")

- EUR/USD takes offers to refresh intraday low, prints three-day losing streak.
- Euro bears attack three-week-old ascending support line, 200-EMA.
- Impending bear cross on MACD, failure to keep bounce off one-week-old horizontal support favor sellers.
- Wait for First Republic bidding results to join hawkish Fed bets to weigh on EUR/USD ahead of key monetary policy meetings.
EUR/USD renews intraday low as bears attack the 1.1000 round figures early Monday amid broad US Dollar strength, as well as sluggish markets due to holidays at many bourses.
Also read: EUR/USD drops towards 1.1000 as ECB hawks retreat, First Bank roils the mood, US NFP, Fed eyed
In doing so, the Euro pair drops for the third consecutive day as it breaks the 200-bar Exponential Moving Average (EMA) and an ascending trend line from April 10.
Given the Euro pair’s failure to defend the previous week’s bounce off short-term horizontal support, coupled with the recently impending bearish signals from the MACD indicator, the EUR/USD sellers are likely to keep the reins.
That said, the major currency pair presently drops towards a horizontal support zone comprising multiple levels marked since April 25, near 1.0960.
However, a two-week-long ascending trend line near 1.0945 could challenge the EUR/USD bears afterward.
On the contrary, EUR/USD recovery may aim for the 1.1050 round figures before directing the pair buyers towards a 12-day-long horizontal resistance area surrounding 1.1065-70.
Following that, the recently marked multi-month high of 1.1095 can prod the Euro pair buyers before directing them to the March 2022 peak close to 1.1185.
EUR/USD: Hourly chart
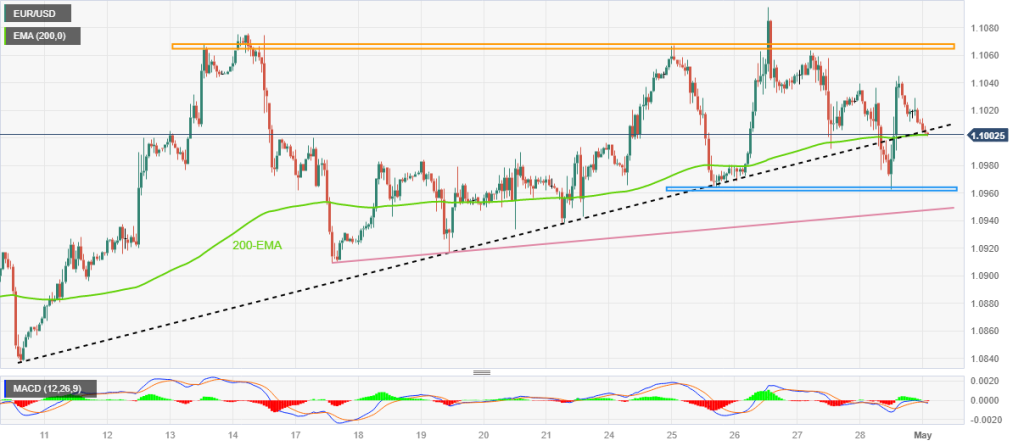
Trend: Further downside expected
ADDITIONAL IMPORTANT LEVELS
| OVERVIEW | |
|---|---|
| Today last price | 1.1002 |
| Today Daily Change | -0.0017 |
| Today Daily Change % | -0.15% |
| Today daily open | 1.1019 |
| TRENDS | |
|---|---|
| Daily SMA20 | 1.0965 |
| Daily SMA50 | 1.0799 |
| Daily SMA100 | 1.0762 |
| Daily SMA200 | 1.0414 |
| LEVELS | |
|---|---|
| Previous Daily High | 1.1045 |
| Previous Daily Low | 1.0962 |
| Previous Weekly High | 1.1095 |
| Previous Weekly Low | 1.0962 |
| Previous Monthly High | 1.1095 |
| Previous Monthly Low | 1.0788 |
| Daily Fibonacci 38.2% | 1.0994 |
| Daily Fibonacci 61.8% | 1.1014 |
| Daily Pivot Point S1 | 1.0973 |
| Daily Pivot Point S2 | 1.0926 |
| Daily Pivot Point S3 | 1.089 |
| Daily Pivot Point R1 | 1.1055 |
| Daily Pivot Point R2 | 1.1092 |
| Daily Pivot Point R3 | 1.1138 |