")

- European Central Bank and US Federal Reserve policymakers maintained the hawkish rhetoric.
- United States Q4 Gross Domestic Product expected to spook the recession ghost.
- EUR/USD buyers on pause amid uncertainty about central banks’ future actions.
The EUR/USD pair finishes the week as it started, trading at around the 1.0820 threshold. The US Dollar attracted investors throughout the first half of the week, but its gains were moderated amid modest optimism leading the way. The Euro began recovering on Wednesday, with EUR/USD reaching a fresh nine-month high of 1.0886, and maintained the advantage heading into Friday’s close.
United States Federal Reserve nowhere near a pivot
Financial markets are still trying to decide where to go next. In the United States, inflationary pressure had receded sharply, confirmed these days by the Producer Price Index (PPI), which rose at an annualized pace of 6.2% in December, easing from 7.3% in the previous month. Softening inflation means the US Federal Reserve (Fed) does not need to continue with the aggressive monetary tightening to tame prices. Higher borrowing costs are a consequence of such a monetary policy, and hence, economic growth tends to slow.
However, several United States Fed policymakers hit the wires with hawkish stances that suggested the central bank would maintain its current path. St. Louis Federal Reserve’s President James Bullard said US interest rates have to rise further to ensure that inflationary pressures recede. Also, Fed’s Loretta Mister, president of the Federal Reserve Bank of Cleveland, welcomed actions to tame inflation, while Fed’s Esther George said that the central bank must restore price stability, “that means returning to 2% inflation.”
EUR/USD technical outlook

The EUR/USD pair has advanced for a fourth consecutive week, and more relevantly, it held above a critical Fibonacci resistance level, the 61.8% retracement of its 2022 slump. It managed to post a higher high and a higher low in the same time frame, which hints at a continued advance ahead of February central banks’ decisions.
However, technical indicators have lost their upward strength within overbought levels, suggesting easing buying interest. The weekly chart also shows that EUR/USD develops far above a bullish 20 Simple Moving Average (SMA), which currently converges with the 38.2% retracement of the 2020 slide at 1.0280. At the same time, the 100 SMA extended its decline below the 200 SMA while above the current level, providing relevant dynamic resistance at around 1.1100. Generally speaking, the weekly chart indicates that bulls retain control of the pair, but also that they are losing conviction. It is worth noting that, at the time being, there are no signs of selling interest.
On a daily basis, technical readings reflect a similar picture to that seen in the larger time frame. EUR/USD bottomed for the week at 1.0765, meeting buyers ahead of the aforementioned Fibonacci support. Technical indicators lack directional strength, the Momentum flat within neutral levels, and the Relative Strength Index (RSI) hovering at around 61, in line with absent bears. At the same time, the 20 SMA advanced throughout the week, maintaining its upward slope a handful of pips below 1.0745. The longer moving averages, in the meantime, slowly grind north below the shorter one, but the 100 SMA still stands far below a flat 200 SMA.
The pair needs to run through the 1.0900 figure to be able to extend gains, with the next relevant resistance level at 1.1020. Beyond the latter, the 1.1100 price zone comes as the next potential target. On the other hand, a daily close below 1.0745 will discourage buyers, and could trigger a downward corrective extension, initially towards 1.0640 and later to 1.0515, the 50% retracement of the 2022 slump.
EUR/USD sentiment poll
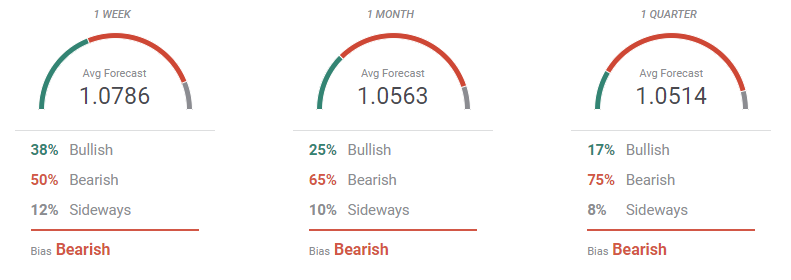
According to the SIGNALS FACTORY,The EUR/USD pair has a limited bullish scope. In the weekly perspective, the pair is seen confined to the 1.0600/1.0900 region, with bears accounting for 50% of the polled experts. The number of those betting for lower levels increases in the monthly view to 65%, while it further raises to 75% in the three-month view, with the pair seen on average at 1.0514.
The Overview chart reflects investors’ uncertainty in the near term. The weekly moving average has turned flat, with most potential targets accumulating below the current level. The monthly and quarterly views offer a wide spread of potential targets, although the bottom end keeps moving higher, alongside the upper one. Gains beyond the 1.1000 psychological mark are at sight, with bets in such a direction growing on a monthly basis.