")

- Gold Finds Support at the $1950 Level Once More, Third Time in as many Weeks
- Acceptance Above $2000 May prove a Hurdle too Far with a Catalyst Likely Needed to Facilitate a Breakout.
- Price Action is Mixed as we Print Lower Highs Followed by Higher Lows.
GOLD (XAU/USD) FUNDAMENTAL BACKDROP
The Gold price has bounced of the $1950 support area as the $2000 psychological level comes into focus more. Gold has now failed to record a daily candle close below $1950 for the third time in the last 10 days as bulls look to make another push for acceptance above the $2000 level.
Chinese data overnight did not help the precious metal as China remains among the world’s largest importers of gold. Caixin PMI data retreated from the February with a print of 50. This had dented optimism around increased demand for the precious metal.
The Dollar has retreated sharply since the London open helping to facilitate a recovery in Gold as the $1950 level appeared vulnerable overnight. The US dollars recent struggles appear to be continuing following a brief pause overnight, while news that certain BRICS member states such as Brazil, China and India are discussing dropping the US Dollar for global trade and forex transactions.
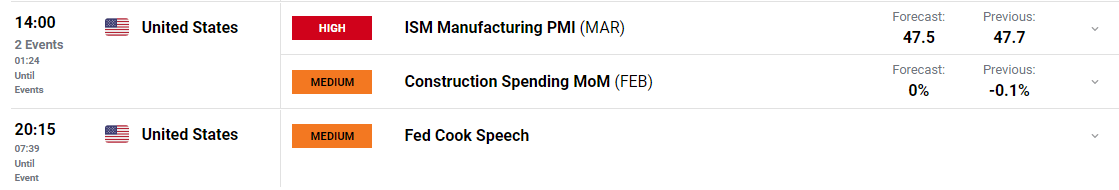
Today brings the ISM PMI Manufacturing data out of the US and comments from Federal Reserve Policymaker Cook which could add volatility to markets and keep gold traders on their toes. However, given the US is primarily a service driven economy, whether this data will be enough of a catalyst remains up for debate.
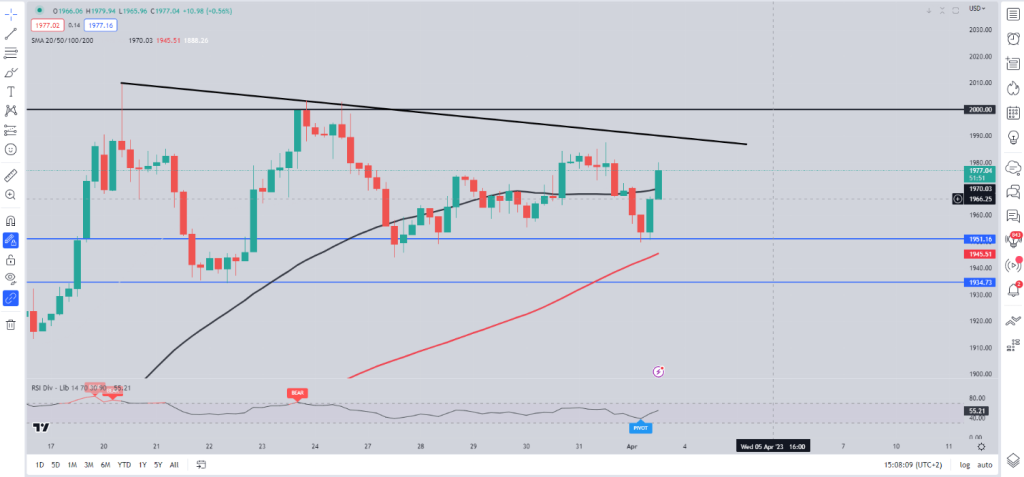
Gold (XAU/USD) Four-Hour Chart – April 3, 2023
TECHNICAL OUTLOOK AND FINAL THOUGHTS
Gold remains in a sort of range since breaking above the $2000 handle 3 weeks ago. The precious metal has made numerous attempts to breach support of $1950 and Resistance around the $2000 with little success.
Looking at 4H chart below we can see price action has been largely indecisive as we have made lower highs followed by higher lows and vice versa. Acceptance above $2000 remains a stumbling block however with a host of technical factors in play at present. We do have the Descending trendline around the $1989 level at present providing resistance The 4H reversal earlier today did see a bullish engulfing candle close, a sign of the momentum behind the direction change. However personally I will be waiting for a daily candle close above the $2000 level to confirm bullish momentum as we have not seen this since the March 2022 rally.