")
- Gold price is showing a sideways performance above $1,980.00 as investors await Fed policy.
- S&P500 futures have recovered more losses recorded in early Asia amid improving risk-taking ability of investors.
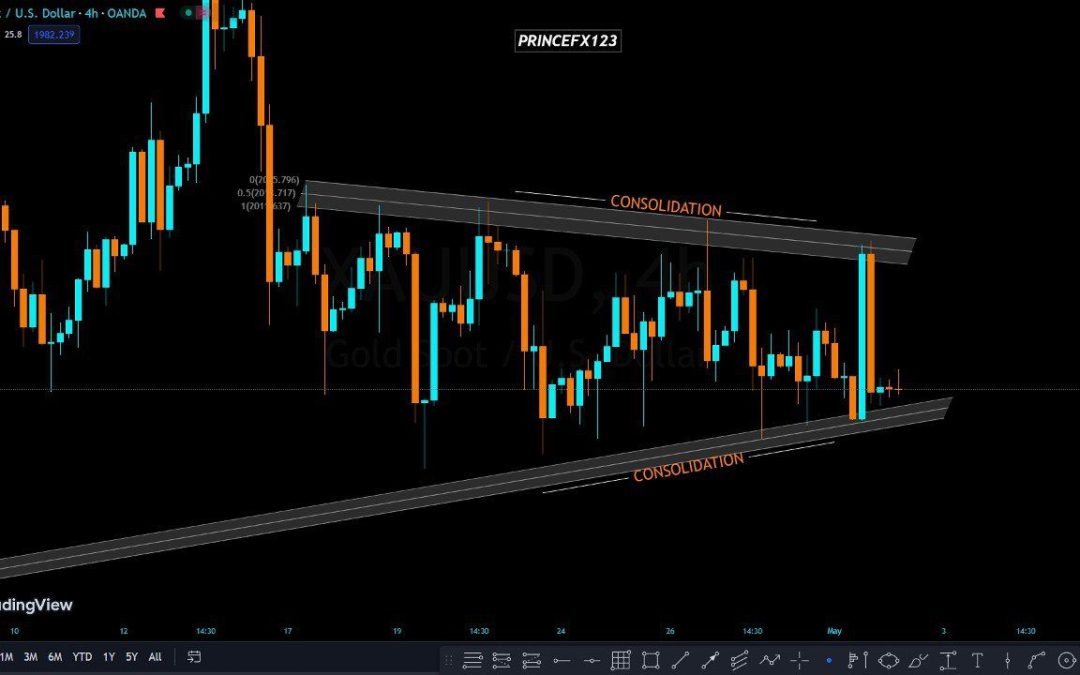
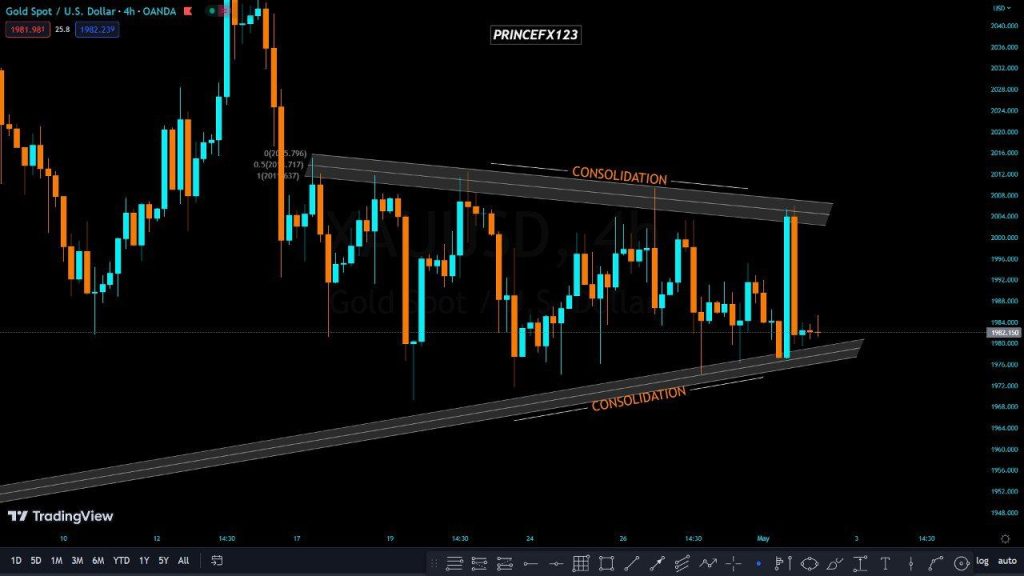
- Gold price is consolidating in a narrow range of $1,971-2,021 from the past week.
Gold price (XAU/USD) is displaying a back-and-forth action above $1,980.00 in the Tokyo session. The precious metal is struggling to find direction as investors are awaiting the announcement of the Federal Reserve’s (Fed) monetary policy and other key United States data.
S&P500 futures have recovered more losses recorded in early Asia amid improving the risk-taking ability of the market participants. The US Dollar Index (DXY) is seeking support after a correction around 102.00. In early Asia, the USD Index dropped after failing to conquer two-week-old resistance at 102.20. It seems that the upside in the USD Index is capped as the street is anticipating neutral guidance from Fed chair Jerome Powell on interest rates.
On Monday, the US ISM Manufacturing PMI (April) managed to rebound to 47.1 from its lowest recording of 46.3 recorded since May 2022. However, a figure below the 50.0 threshold is considered a contraction in economic activity. The US Manufacturing PMI Has remained below 50.0 straight for the sixth time as higher interest rates by the Fed and bleak demand outlook have forced firms for capacity underutilization.
Going forward, US Automatic Data Processing (ADP) Employment data will be of significant importance. According to the estimates, the US labor market has witnessed an addition of 150K fresh addition of employees, higher than the former release of 145K.
Gold technical analysis
Gold price is consolidating in a narrow range of $1,971-2,021 from the past week as investors are awaiting the monetary policy by the Fed for a decisive move. Upward-sloping trendline March 22 low at $1,934.34 is acting as a cushion for the Gold bulls.
The 20-period Exponential Moving Average (EMA) at $1,990.28 is showing stickiness to the Gold price, indicating a lackluster performance.
Meanwhile, the Relative Strength Index (RSI) (14) is on the verge of slipping into the bearish range of 20.00-40.00, which will activate the bearish momentum.
Gold four-hour chart
XAU/USD
| OVERVIEW | |
|---|---|
| Today last price | 1982.18 |
| Today Daily Change | -0.36 |
| Today Daily Change % | -0.02 |
| Today daily open | 1982.54 |
| TRENDS | |
|---|---|
| Daily SMA20 | 2000.34 |
| Daily SMA50 | 1936.81 |
| Daily SMA100 | 1899.39 |
| Daily SMA200 | 1808.69 |
| LEVELS | |
|---|---|
| Previous Daily High | 2006.06 |
| Previous Daily Low | 1977.12 |
| Previous Weekly High | 2009.41 |
| Previous Weekly Low | 1974.13 |
| Previous Monthly High | 2048.75 |
| Previous Monthly Low | 1949.83 |
| Daily Fibonacci 38.2% | 1988.18 |
| Daily Fibonacci 61.8% | 1995 |
| Daily Pivot Point S1 | 1971.09 |
| Daily Pivot Point S2 | 1959.63 |
| Daily Pivot Point S3 | 1942.15 |
| Daily Pivot Point R1 | 2000.03 |
| Daily Pivot Point R2 | 2017.51 |
| Daily Pivot Point R3 | 2028.97 |