")
- Gold price has stretched its rally above $1,960.00 amid a risk-on mood.
- The interest rate decision of skipping interest rate hikes by the Fed has provided relief to the market participants.
- Gold price has delivered a breakout of the Falling Channel pattern, which supports a bullish reversal.
Gold price (XAU/USD) has stretched its rally to near $1,964.00 in the European session. The precious metal is expected to deliver more gains as the USD Index (DXY) looks vulnerable above the crucial support of 102.00.
S&P500 futures have recovered entire losses posted in Asia and has shifted into positive territory as the risk appetite theme is getting traction. The US Dollar Index (DXY) is consolidating in a narrow range above 102.00. US Treasury yields are also choppy amid a lack of potential triggers ahead.
The interest rate decision of skipping interest rate hikes by the Federal Reserve (Fed) has provided relief to the market participants. The neutral decision of Fed chair Jerome Powell was followed by a hawkish dot plot in which it is confirmed that two more interest rate hikes will be announced. However, investors are hoping that current United States economic prospects are turning vulnerable as labor market conditions are further easing now.
On Thursday, the US Department of Labor reported higher-than-expected jobless claims straight for four weeks. It seems that higher interest rates by the Fed and tight credit conditions by US regional banks have put a lid on the route of credit disbursals to firms, which has forced them to underutilize their total capacity.
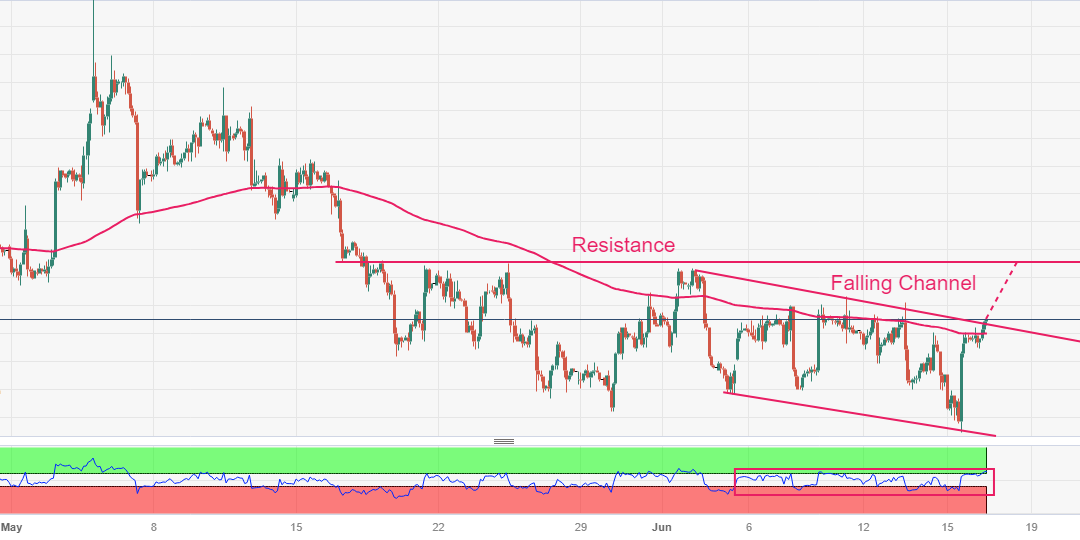
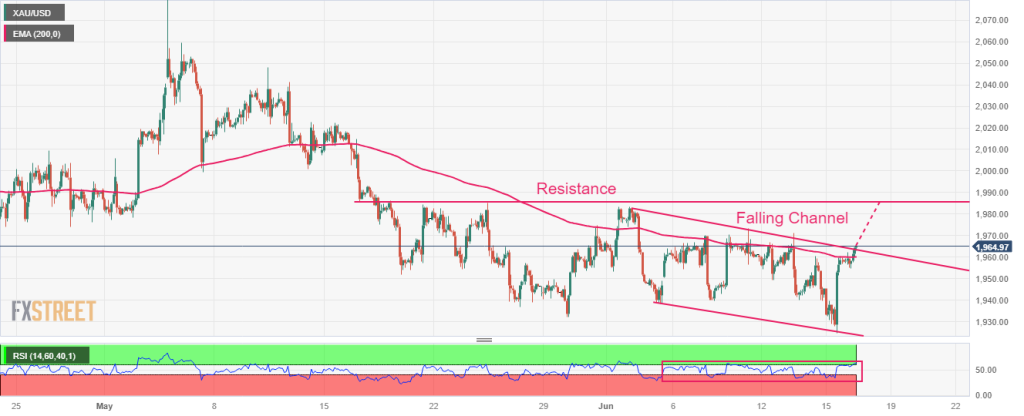
Gold technical analysis
Gold price has delivered a breakout of the Falling Channel chart pattern formed on a two-hour scale. A breakout of the aforementioned chart pattern supports a bullish reversal. The precious metal is approaching the horizontal resistance plotted from May 16 low at $1,985.53.
Gold price has climbed above the 200-period Exponential Moving Average (EMA) at $1,960.00, which indicates that the long-term trend has turned bullish.
The Relative Strength Index (RSI) (14) is looking to shift into the bullish range of 60.00-80.00. An occurrence of the same will activate the upside momentum.
Gold two-hour chart
XAU/USD
| OVERVIEW | |
|---|---|
| Today last price | 1964.99 |
| Today Daily Change | 6.87 |
| Today Daily Change % | 0.35 |
| Today daily open | 1958.12 |
| TRENDS | |
|---|---|
| Daily SMA20 | 1957.79 |
| Daily SMA50 | 1986.32 |
| Daily SMA100 | 1941.79 |
| Daily SMA200 | 1846.39 |
| LEVELS | |
|---|---|
| Previous Daily High | 1960.31 |
| Previous Daily Low | 1924.85 |
| Previous Weekly High | 1973.15 |
| Previous Weekly Low | 1938.15 |
| Previous Monthly High | 2079.76 |
| Previous Monthly Low | 1932.12 |
| Daily Fibonacci 38.2% | 1946.76 |
| Daily Fibonacci 61.8% | 1938.4 |
| Daily Pivot Point S1 | 1935.21 |
| Daily Pivot Point S2 | 1912.3 |
| Daily Pivot Point S3 | 1899.75 |
| Daily Pivot Point R1 | 1970.67 |
| Daily Pivot Point R2 | 1983.22 |
| Daily Pivot Point R3 | 2006.13 |