")
- Gold Price stays pressured at five-week low as bears eye yearly bottom.
- China fans risk-off mood amid sluggish start to key week, yields underpin US Dollar demand.
- More clues of US inflation, FOMC Minutes will be eyed for fresh impulse.
Gold Price (XAU/USD) keeps bears on the driver’s seat at the monthly low, after witnessing a four-week downtrend, as headlines from China roil market sentiment and underpin the US Dollar’s haven demand. Adding strength to the risk-off mood are the geopolitical concerns about Russia and the firmer US Treasury bond yields, which in turn allows the US Dollar Index (DXY) to remain firmer after rising in the last four consecutive weeks despite looming policy pivot at the Federal Reserve (Fed).
It’s worth noting that a suspension of its bond trading by China’s Country Garden joins the non-receipt of the payments from a subsidiary of Chinese conglomerate Zhongzhi Enterprise Group to bolster the debt woes of China. Elsewhere, Russia’s readiness to equip new nuclear submarines with hypersonic missiles and the US-China trade war also contributes to the risk-off mood, which in turn weighs on the XAU/USD Price.
Elsewhere, mostly upbeat US inflation clues contrast with the dovish interest rate futures, suggesting no Fed rate hike in September, to challenge the US Dollar ahead of more clues about the US price pressure and the Fed Minutes.
Gold Price: Key levels to watch
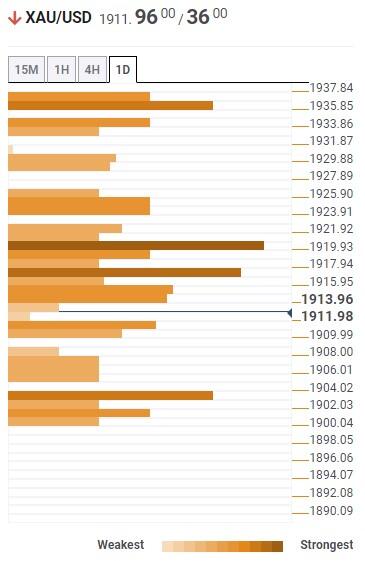
Our Technical Confluence indicator suggests that the Gold Price stays well beneath the key $1,920 resistance confluence comprising the 5-DMA, Fibonacci 23.6% on one-week and Pivot Point one-day R1.
Also keeping the XAU/USD bears hopeful is the quote’s clear downside break of the $1,918 support, now immediate resistance encompassing Pivot Point one-month S1 and Fibonacci 38.2% on one-day.
With this, the Gold Price appears well set to drop toward the previous monthly low of around $1,900.
However, the quote’s weakness past $1,900 has a space to fill unless hitting the yearly low marked in June around $1,893.
Meanwhile, a clear upside break of the $1,920 resistance confluence could propel the Gold Price towards the $1,935 level encompassing Pivot Point one-week R1 and Fibonacci 61.8% on one-month.
Here is how it looks on the tool

About Technical Confluences Detector
The TCD (Technical Confluences Detector) is a tool to locate and point out those price levels where there is a congestion of indicators, moving averages, Fibonacci levels, Pivot Points, etc. If you are a short-term trader, you will find entry points for counter-trend strategies and hunt a few points at a time. If you are a medium-to-long-term trader, this tool will allow you to know in advance the price levels where a medium-to-long-term trend may stop and rest, where to unwind positions, or where to increase your position size.