")

- Gold price retreats from intraday high, fades week-start rebound.
- Sour sentiment puts a floor under US Dollar amid debt ceiling drama, pre-Fed consolidation.
- Softer US Q1 GDP, Core PCE Price Index can confirm Fed policy pivot talks and propel XAU/USD bulls.
- Fewer hurdles stand to challenge Gold Price upside past $2,010, XAU/USD sellers should wait for $1,987 break.
Gold price (XAU/USD) consolidates the last two-week losses as market sentiment dwindles amid a light calendar, allowing traders to better prepare for the key US Q1 GDP and Core PCE Price Index, the Fed’s favourite inflation gauge.
It’s worth noting, however, that the quote’s corrective bounce needs validation from the $2,000 psychological magnet and the aforementioned key US data as traders struggle with the US debt ceiling concerns and the pre-Fed preparations. Apart from the sour sentiment and pre-data/event consolidation, the Gold Price remains firmer amid the US Dollar’s failure to cheer the sour sentiment, despite stopping the further downside of the greenback.
Moving on, Gold price remains directed toward the north amid broad US Dollar weakness but the quote’s further upside needs validation from the downbeat US Q1 GDP and the Fed’s favourite inflation gauge.
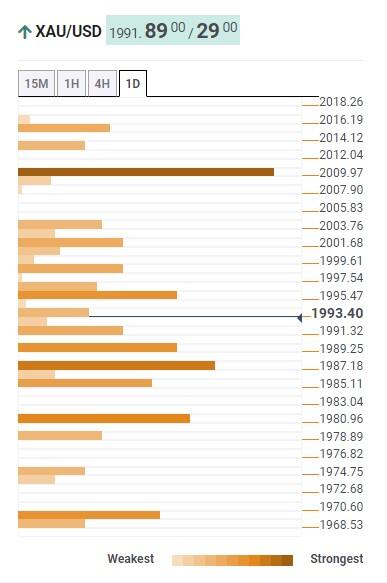
Gold Price: Key levels to watch
As per out Technical Confluence indicator Gold price retreats from a convergence of the Bollinger on the one-day and Pivot Point one-day R1, around the $2,000 psychological magnet.
Following that, the $2,010 level becomes a tough nut to crack for the Gold price as it comprises the Pivot Point one week R1 and the previous monthly high.
In a case where the Gold price remains firmer past $2,010, the odds of witnessing a run-up towards the monthly high surrounding $2,050 can’t be ruled out.
Alternatively, Fibonacci 38.2% on one week and 23.6% on one day together highlight $1,987 as the immediate key support of around $1,987.
Should the Gold price remains weak past $1,987, the Fibonacci 61.8% on one day and 23.6% on one week will highlight the $1,980 as the last defense of the XAU/USD bulls.
Here is how it looks on the tool
About Technical Confluences Detector
The TCD (Technical Confluences Detector) is a tool to locate and point out those price levels where there is a congestion of indicators, moving averages, Fibonacci levels, Pivot Points, etc. If you are a short-term trader, you will find entry points for counter-trend strategies and hunt a few points at a time. If you are a medium-to-long-term trader, this tool will allow you to know in advance the price levels where a medium-to-long-term trend may stop and rest, where to unwind positions, or where to increase your position size.