")
- Gold price is looking for stabilization above $1,930.00 amid a sell-off in the USD Index.
- S&P500 futures have recovered the majority of losses, portraying a recovery in the risk appetite.
- Gold price is approaching the upper portion of the Falling Channel chart pattern.
Gold price (XAU/USD) has climbed marginally above the crucial resistance of $1,930.00 in the London session. The precious metal is looking for stability above $1,930.00 as the US Dollar Index (DXY) is facing pressure. The USD Index has corrected to near 102.63 as the investing community is mixed about further monetary policy by the Fed.
S&P500 futures have recovered the majority of losses, portraying a recovery in the risk appetite of the market participants. US 500 basket is expected to open on a cautious note as investors are worried about the quarterly result season, which will kick-start sooner.
The yellow metal is also showing some resilience due to severe correction in the US Treasury yields. The 10-year US Treasury yields have dropped sharply to near 3.68%. Analysts at Rabobank expect the Fed to hike in July, a more moderate pace would imply skipping September and that would leave us with November as the meeting for the second hike.
The street will keep the focus on the labor market and inflation data for June as further resilience would propel the need for more restrictive monetary policy. Going forward, US Durables Goods Orders data will remain in the spotlight.
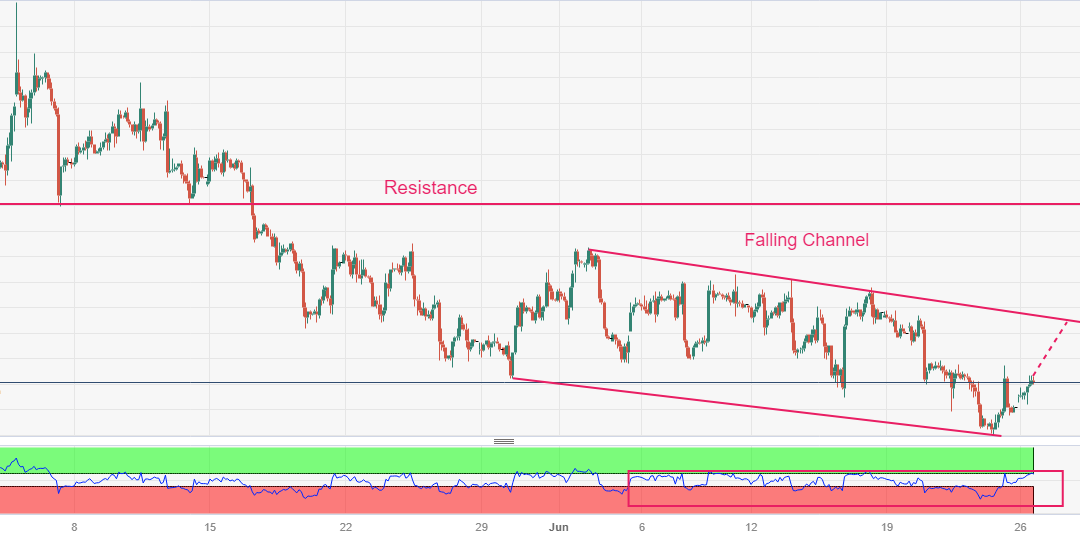
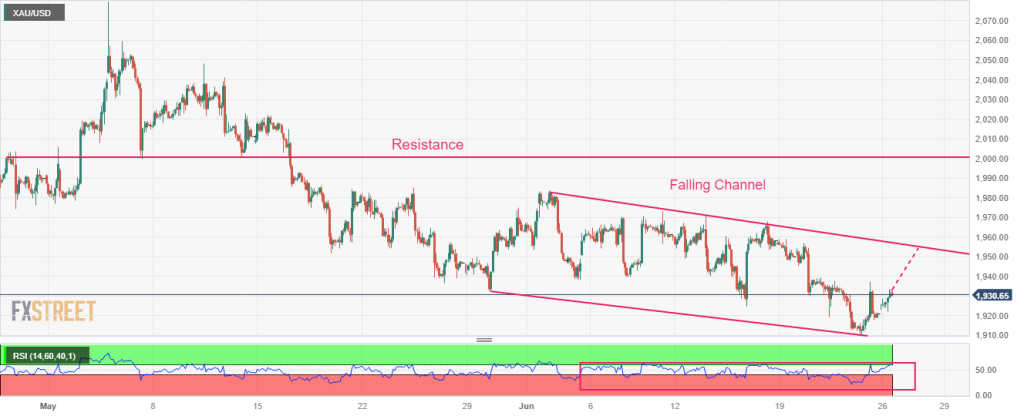
Gold technical analysis
Gold price is approaching the upper portion of the Falling Channel chart pattern on a two-hour scale in which each pullback is considered as a selling opportunity by the market participants. Horizontal resistance is plotted from May 05 low around $2,000.00.
The Relative Strength Index (RSI) (14) is widely oscillating in the bearish range of 20.00-60.00 in which an oscillation near 60.00 would trigger gold sellers.
Gold two-hour chart
XAU/USD
| OVERVIEW | |
|---|---|
| Today last price | 1930.03 |
| Today Daily Change | 9.23 |
| Today Daily Change % | 0.48 |
| Today daily open | 1920.8 |
| TRENDS | |
|---|---|
| Daily SMA20 | 1949.86 |
| Daily SMA50 | 1977.31 |
| Daily SMA100 | 1942.17 |
| Daily SMA200 | 1853.37 |
| LEVELS | |
|---|---|
| Previous Daily High | 1937.45 |
| Previous Daily Low | 1910.18 |
| Previous Weekly High | 1958.85 |
| Previous Weekly Low | 1910.18 |
| Previous Monthly High | 2079.76 |
| Previous Monthly Low | 1932.12 |
| Daily Fibonacci 38.2% | 1927.03 |
| Daily Fibonacci 61.8% | 1920.6 |
| Daily Pivot Point S1 | 1908.17 |
| Daily Pivot Point S2 | 1895.54 |
| Daily Pivot Point S3 | 1880.9 |
| Daily Pivot Point R1 | 1935.44 |
| Daily Pivot Point R2 | 1950.08 |
| Daily Pivot Point R3 | 1962.71 |