- Gold Price stays defensive after reversing from the highest level in a month.
- Latest US data about inflation, activities cause turbulence by testing Fed policy pivot concerns.
- Strong US employment figures needed to defend “higher for longer” rate bias and can weigh on XAU/USD price.
- Downbeat NFP will help Gold buyers to keep the reins for the second consecutive week.
Gold Price (XAU/USD) aptly portrays the pre-NFP trading lull as bulls take a breather above the key support confluence while bracing for the second consecutive weekly gain. In doing so, the XAU/USD also portrays the market’s indecision about the Federal Reserve’s (Fed) next move as the latest round of US economics hasn’t been supportive to policy hawks, which in turn highlights today’s US jobs report for decision-making.
That said, the recent price pressure data from the US suggests ‘sticky’ service inflation and an absence of major reductions in the activities. However, the downbeat sentiment and unimpressive prints of the early signals surrounding the US employment conditions prod the rate hike expectations.
Elsewhere, a slew of measures from China to defend the economy from slipping back into COVID-like days seem to put a floor under the Gold Price, due to Beijing’s status as one of the top XAU/USD customers. Among them, the People’s Bank of China’s (PBoC) 2.0% cut to the foreign exchange reserve ratio and a reduction of the Yuan deposit rates by multiple Chinese banks gained major attention.
It’s worth noting that the broad view of an end to the rate hike trajectory, amid recently softer inflation numbers from the top-tier economies, seems to defend the Gold buyers.
Moving on, US Nonfarm Payrolls (NFP), Unemployment Rate and Average Hourly Earnings for August will be crucial for clear directions as the last few months of data have teased the Fed doves, suggesting a need for the strong outcomes to prod Gold Price upside.
Gold Price: Key levels to watch
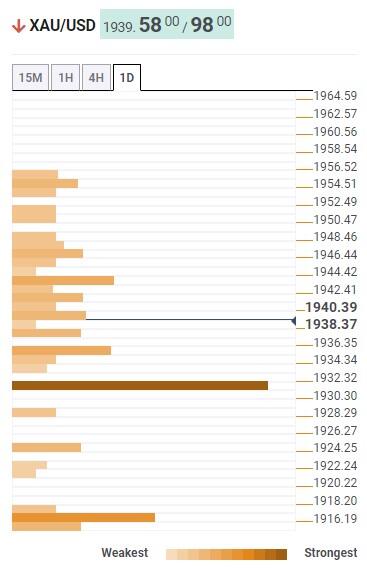
As per our Technical Confluence indicator, the Gold Price floats firmly beyond the $1,932 support confluence despite the latest retreat. That said, the stated key support comprises the 50-DMA, Pivot Point one-week R1 and 5-DMA.
Also restricting the short-term downside of the XAU/USD is the $1,936 level encompassing the 61.8% Fibonacci retracement on one-month.
It’s worth noting, however, that the Gold Price weakness past $1,930 makes it vulnerable to drop towards the $1,916 support confluence comprising the middle band of the Bollinger on the daily chart, Fibonacci 38.2% on one-month and 10-DMA.
Alternatively, the Fibonacci 38.2% on one-day guards immediate recovery of the Gold Price near $1,945.
Following that, a convergence of the 100-DMA and Pivot Point one-day R3 will act as the last defense of the XAU/USD sellers around $1,955, a break of which could propel the Gold Price towards the multiple hurdles marked during May and July around $1,985.
Overall, the Gold Price has fewer barriers toward the north but the US employment data can test the bulls.
Here is how it looks on the tool

About Technical Confluences Detector
The TCD (Technical Confluences Detector) is a tool to locate and point out those price levels where there is a congestion of indicators, moving averages, Fibonacci levels, Pivot Points, etc. If you are a short-term trader, you will find entry points for counter-trend strategies and hunt a few points at a time. If you are a medium-to-long-term trader, this tool will allow you to know in advance the price levels where a medium-to-long-term trend may stop and rest, where to unwind positions, or where to increase your position size.

