Gold Price is attempting a recovery from two-month lows of $1,872, heading back towards the $1,900 threshold. Investors resort to profit-taking in their US dollar long positions following the latest upsurge while progressing towards critical America’s Q1 preliminary GDP release. The world’s largest economy is likely to see a dramatic slowdown in growth in the beginning of this year. If the US GDP prints a negative reading, the dollar rally could regain momentum, as recession fears could likely creep in and trigger a flight to safety across the board. In such a case, Gold Price could resume the downside towards the $1,850 mark. In the meantime, the upbeat market mood is taking the steam out of the dollar rally, offering some temporary reprieve to XAUUSD bulls.
A weak US GDP reading is unlikely to move the markets’ pricing of the Fed tightening. In fact, the US central bank is expected to hike interest rates by 50 bps when it meets on May 3-4, and again in June and July, and ultimately lift rates to around 3.0% by the end of the year. The bets were reaffirmed by hawkish comments by various FOMC members, including Fed Chair Jerome Powell last week. This, along with inflation fears, remained supportive of elevated US Treasury bond yields and underpinned the buck.
Meanwhile, analysts at ANZ Bank argued that escalating geopolitical risk and inflation should continue to underpin investment demand. Adding to this, analysts at TD Securities said: while the yellow metal’s prices have remained extremely resilient against an aggressively hawkish Fed, as a protracted war in Ukraine simultaneously raised both geopolitical uncertainty and inflation risks and thereby fueled demand for havens, we see few participants left with an appetite to buy gold. The analysts explained that Comex shorts have largely been wiped out, removing some fuel for price strength, while safe-haven flows have a historical tendency to dissipate.
Gold technical analysis
On a four-hour scale, XAU/USD is facing barricades near the supply zone placed in a narrow range of $1,890.21-1,895.15. The 20- and 50-period Exponential Moving Averages (EMAs) at $1,905.31 and $1,925.57 respectively are heading south, which adds to the downside filters. Meanwhile, the Relative Strength Index (RSI) (14) is oscillating in a bearish range of 20.00-40.00, which signals more pain ahead.
Gold four-hour chart
-637866949020827975.png)
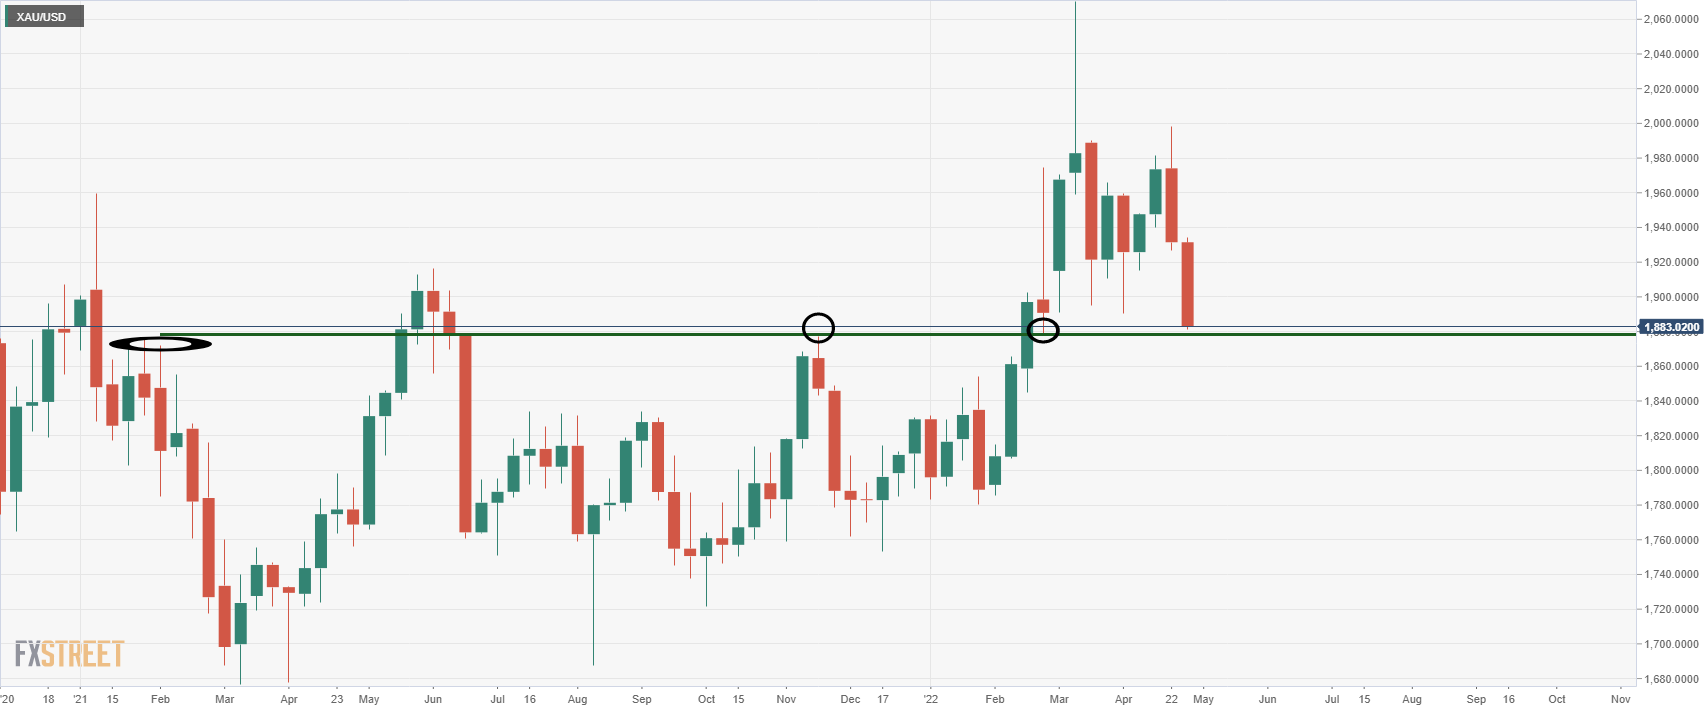
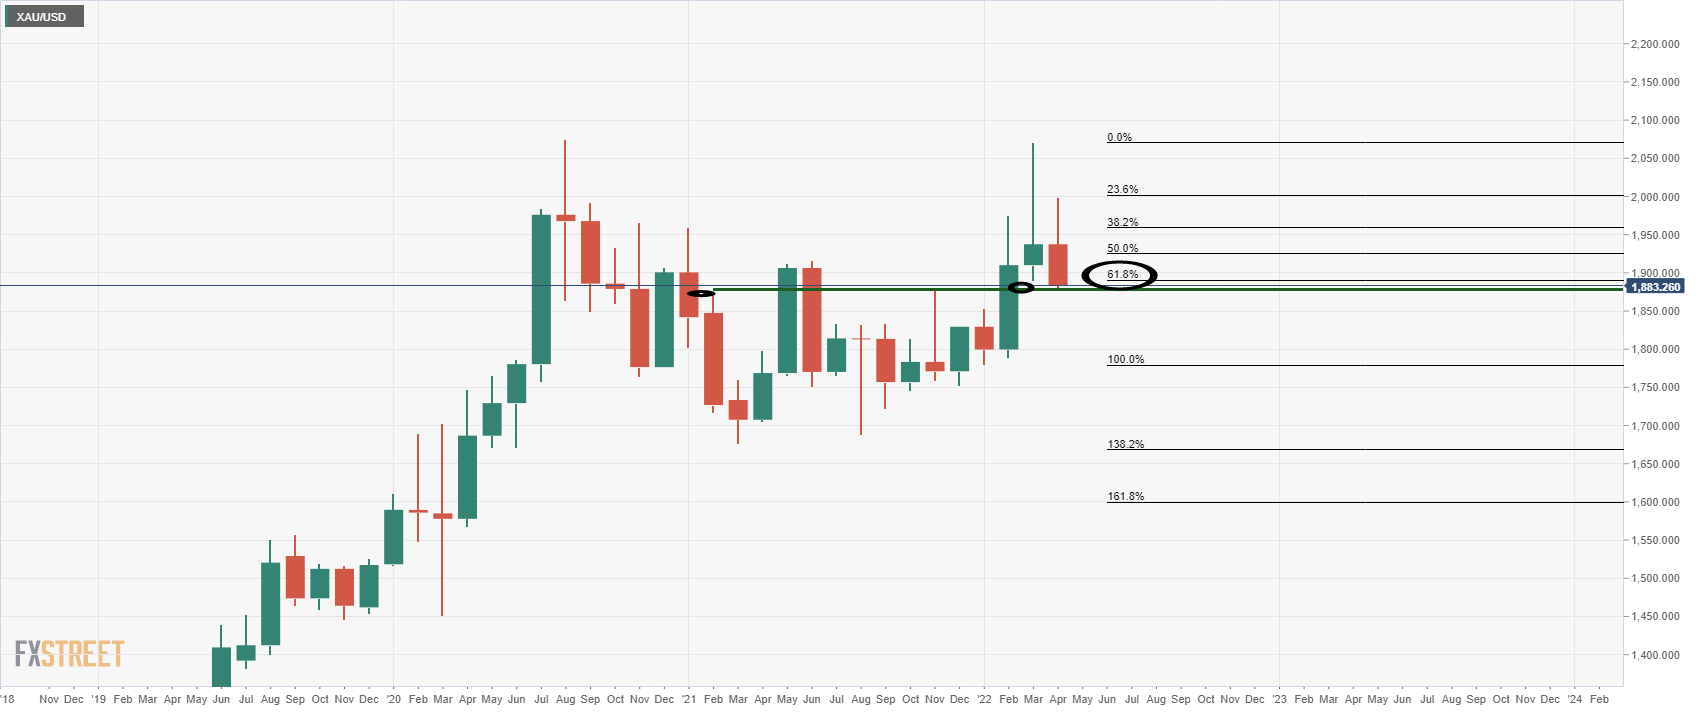
As for the longer-term charts, the gold price is headed to a potentially strong area of support:

The weekly chart is homing in on prior support and resistance while the monthly chart sees the gold price already meeting the 61.8% golden ratio.

