")

- XAU/USD remains above vital support despite the jump in US Treasury yields.
- Retail traders’ long positioning looks stretched.
- What is the outlook and key levels to watch in XAU/USD?
Gold is at a critical juncture – stretched retail traders’ long positioning poses downside risks to XAU/USD. However, if the past is any guide, the yellow metal may not be ripe for a bearish break just yet.
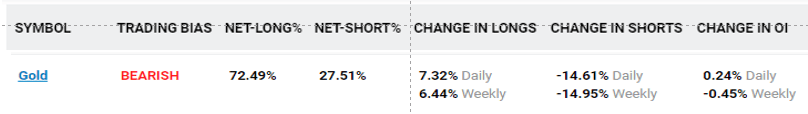
The IG Client Sentiment (IGCS) shows 72% of retail traders are net-long with the ratio of long to short at 2.6 to 1. The number of traders net-long is 6.4% higher from last week. The IGCS data at times functions as a contrarian indicator – the fact traders are net-long suggests the next move in gold could be down.
XAU/USD Daily Chart
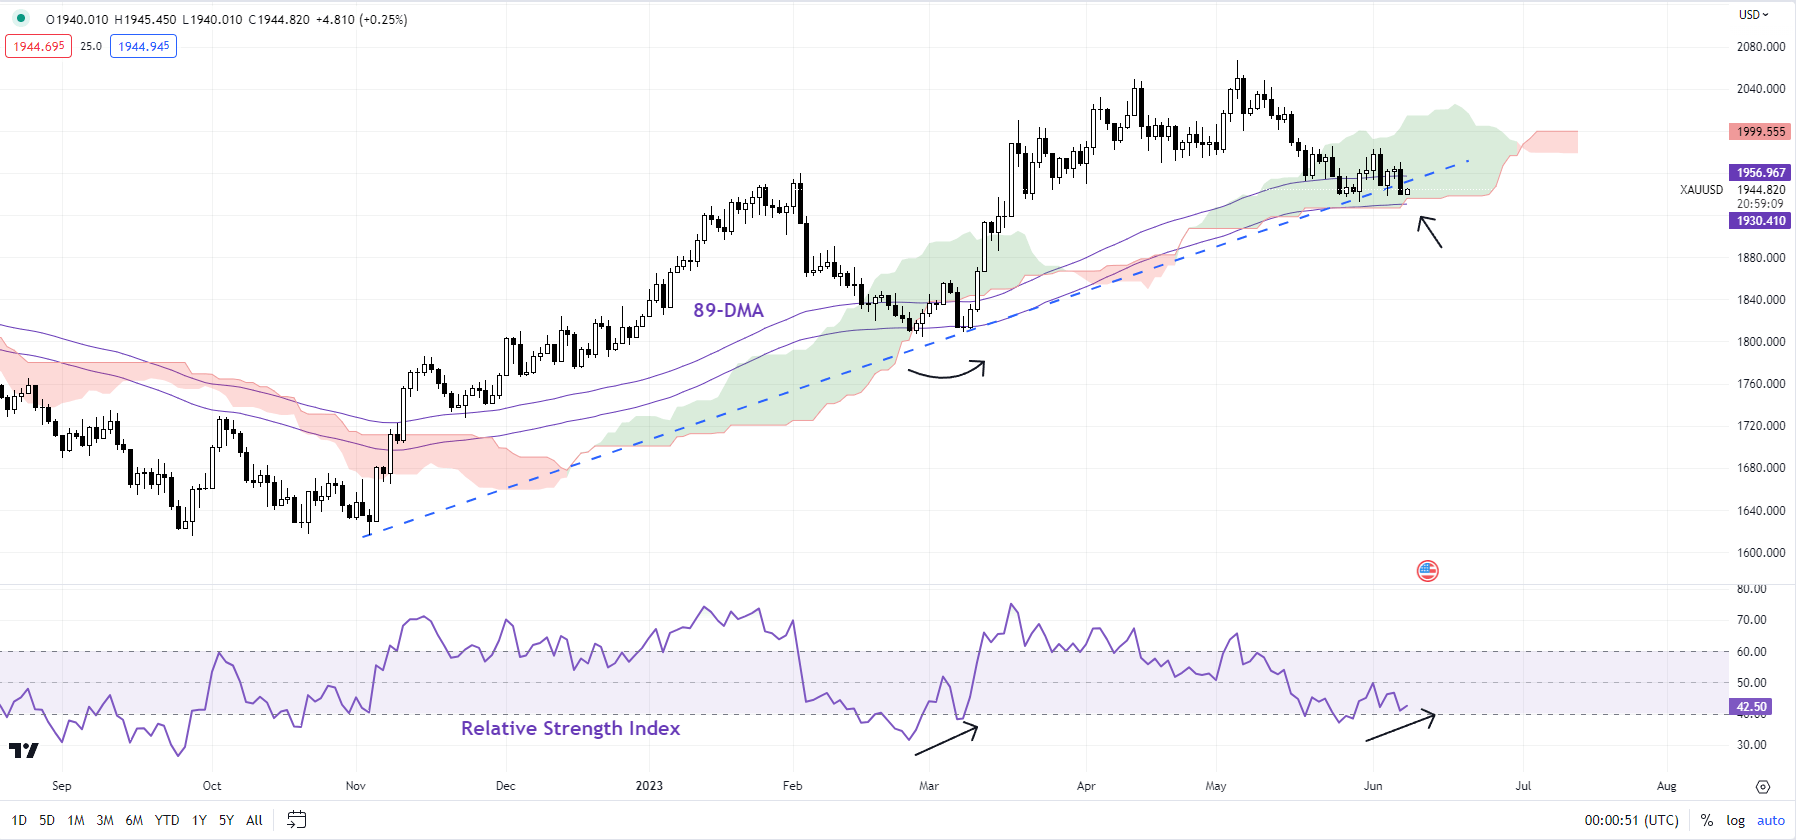
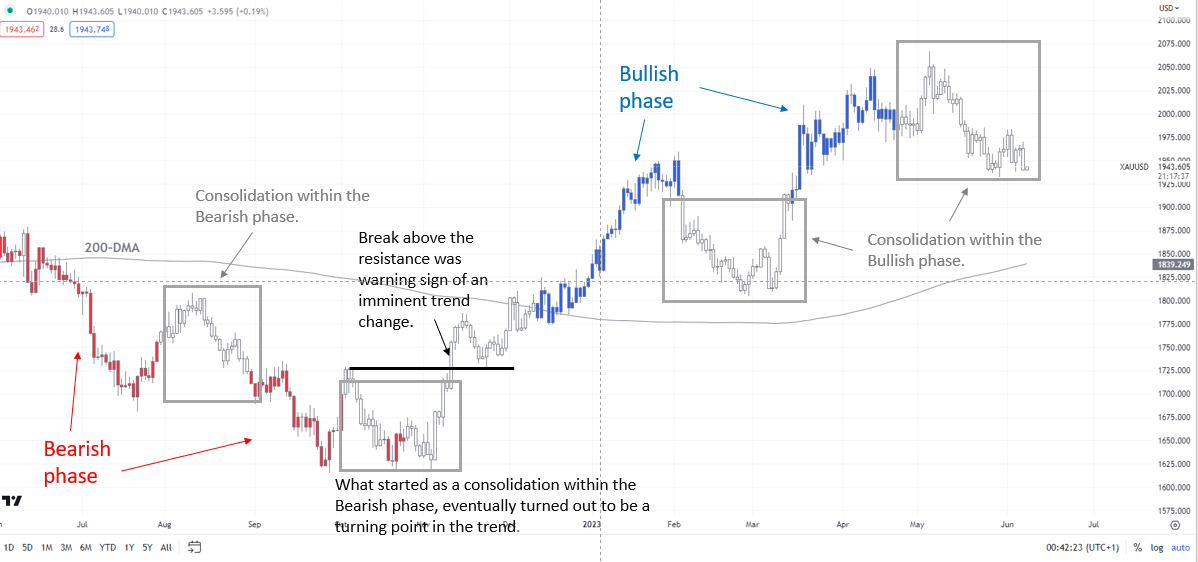
The technical setup remains broadly unchanged from the previous update. See “Retreat in US Yields Supports Gold, But for How Long? XAU/USD, XAU/EUR Price Setups”, published May 31. On the daily chart, gold remains above quite a strong cushion around 1930, including an uptrend line from the end of 2022, the 89-day moving average, and the lower edge of the Ichimoku cloud. The colour-coded candlestick daily charts show the current trend is a consolidation within the overall bullish structure.
XAU/USD 240-minute Chart
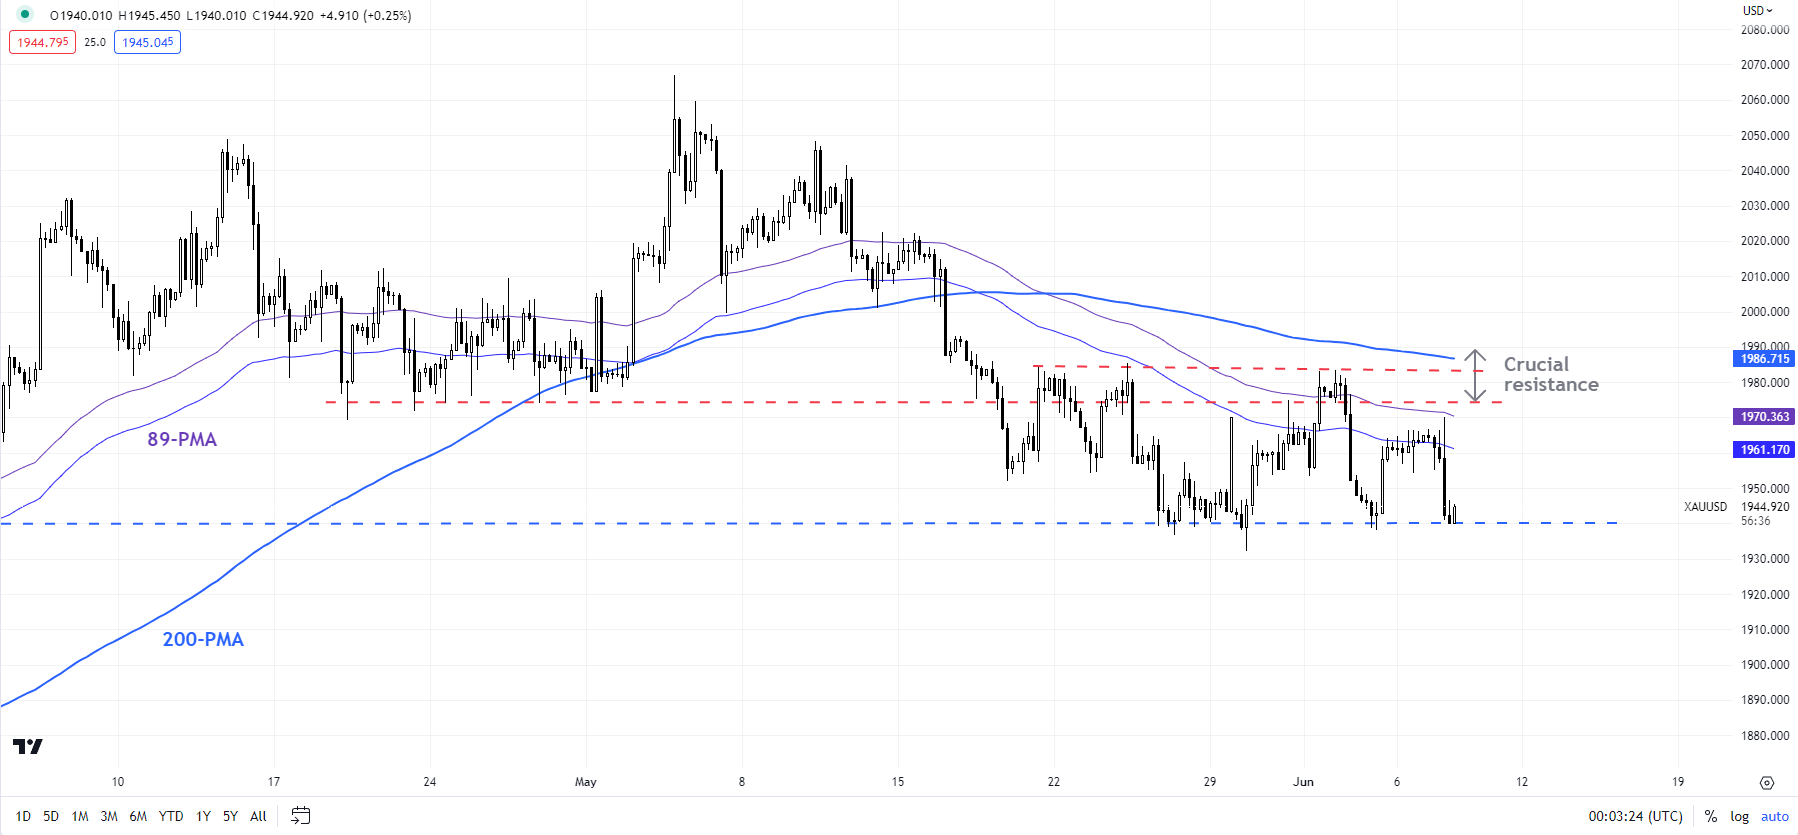
Interestingly, the 14-day Relative Strength Index (RSI) is attempting to form a base – the previous retreat earlier this year terminated with a similar setup (see the daily chart). For a material rebound to occur this time around, XAU/USD would need to clear the immediate ceiling around 1980-1987 (including the 200-period moving average on the 240-minute chart and Friday’s high).
XAU/USD 240-minute Chart
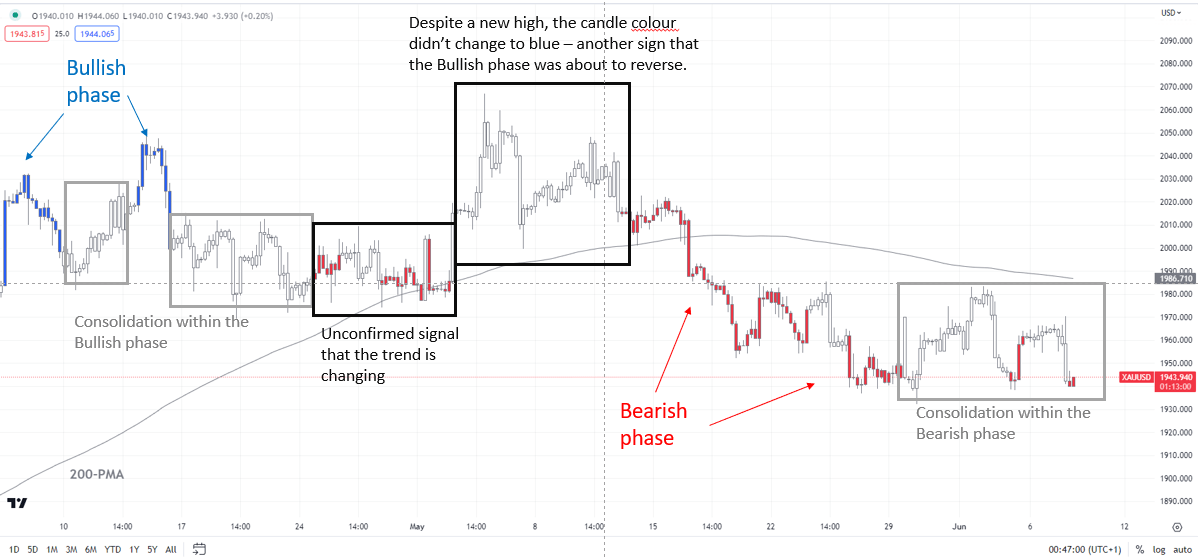
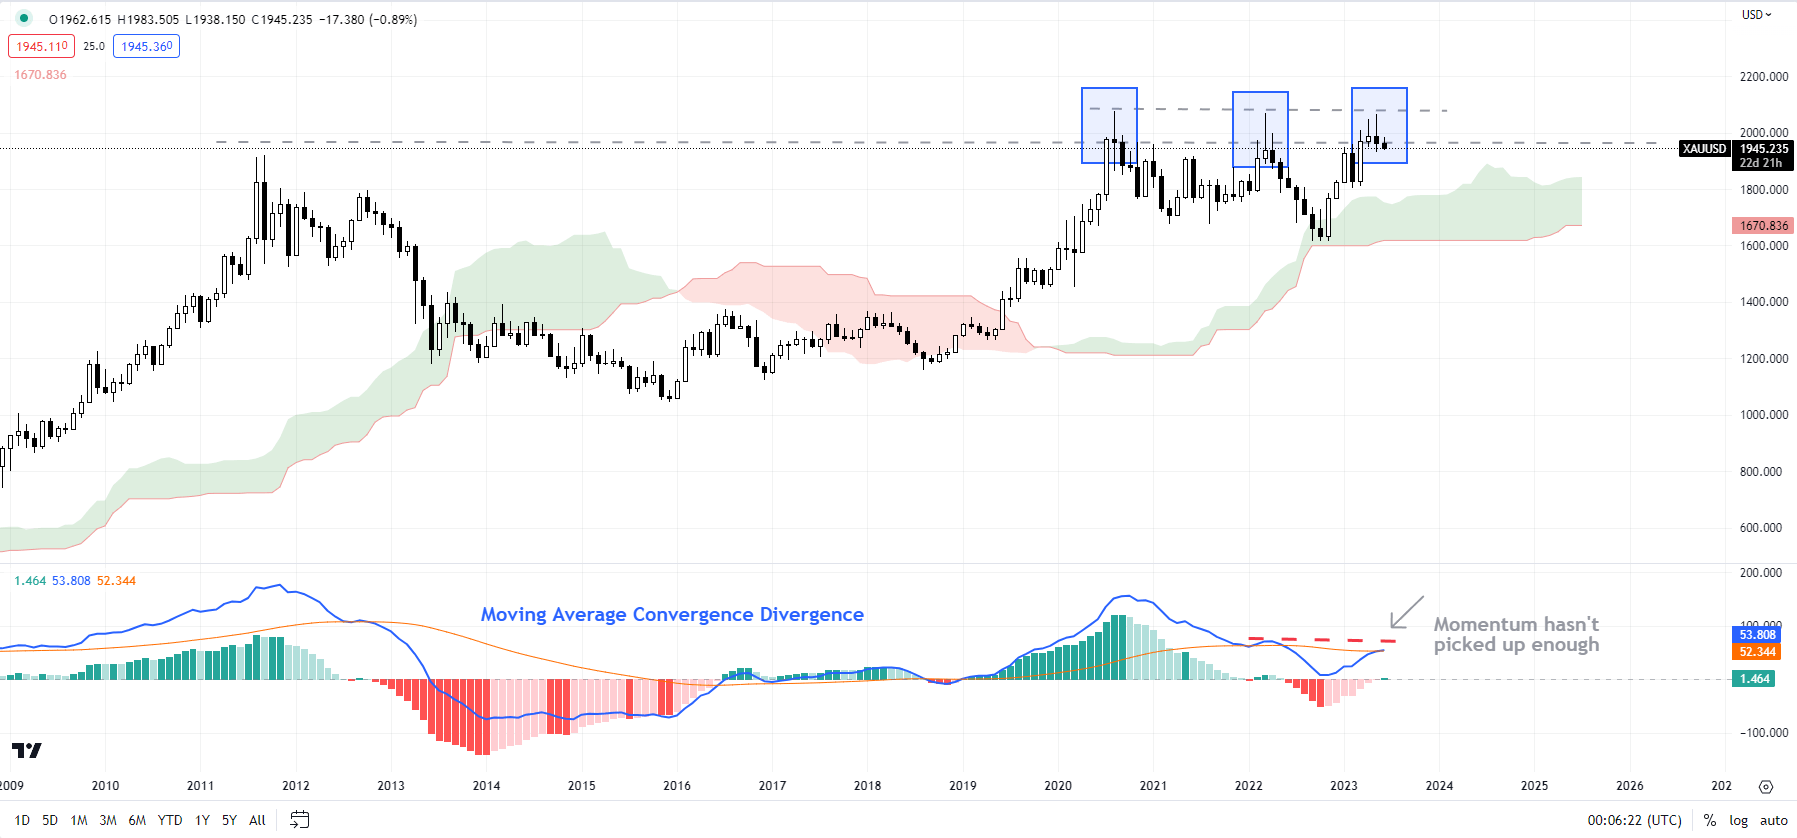
Until then, the bearish setup on smaller and higher timeframes could dominate. The 240-minute colour-coded candlestick charts show XAU/USD remains in a broadly bearish phase. In recent months, the momentum on higher timeframe charts has been a concern – see previous updates on March 28,April 16,April 24,May 10, and “Is This the Moment of Reckoning for Gold?”, published May 17.
XAU/USD Daily Chart
Any break above 1980-1987 could expose upside scenarios toward 2020 or even 2048. On the downside, a decisive break under 1930 could open the door toward the 200-day moving average (now at about 1840).
XAU/USD Monthly Chart
Note: The above colour-coded chart(s) is(are) based on trending/momentum indicators to minimize subjective biases in trend identification. It is an attempt to segregate bullish Vs bearish phases, and consolidation within a trend Vs reversal of a trend. Blue candles represent a Bullish phase. Red candles represent a Bearish phase. Grey candles serve as Consolidation phases (within a Bullish or a Bearish phase), but sometimes they tend to form at the end of a trend. Candle colors are not predictive – they merely state what the current trend is. Indeed, the candle color can change in the next bar. False patterns can occur around the 200-period moving average, or around a support/resistance and/or in sideways/choppy market. The author does not guarantee the accuracy of the information. Past performance is not indicative of future performance. Users of the information do so at their own risk.