")

- Federal Reserve implied rate probabilities are becoming increasingly more responsive to inflation and labor data showing market indecision ahead of the Fed’s March meeting.
- US economic data the focus for next week.
- Technical analysis on weekly and daily charts favor bulls.
Where to begin with Gold prices? A rollercoaster ride last week saw the yellow metal close significantly higher on the back of US Non-Farm Payroll (NFP) data. Markets honed in on the higher unemployment and declining wage data rather than the headline NFP release. This mixed bag of data will place greater emphasis on the upcoming US CPI report (see economic calendar below) for guidance.
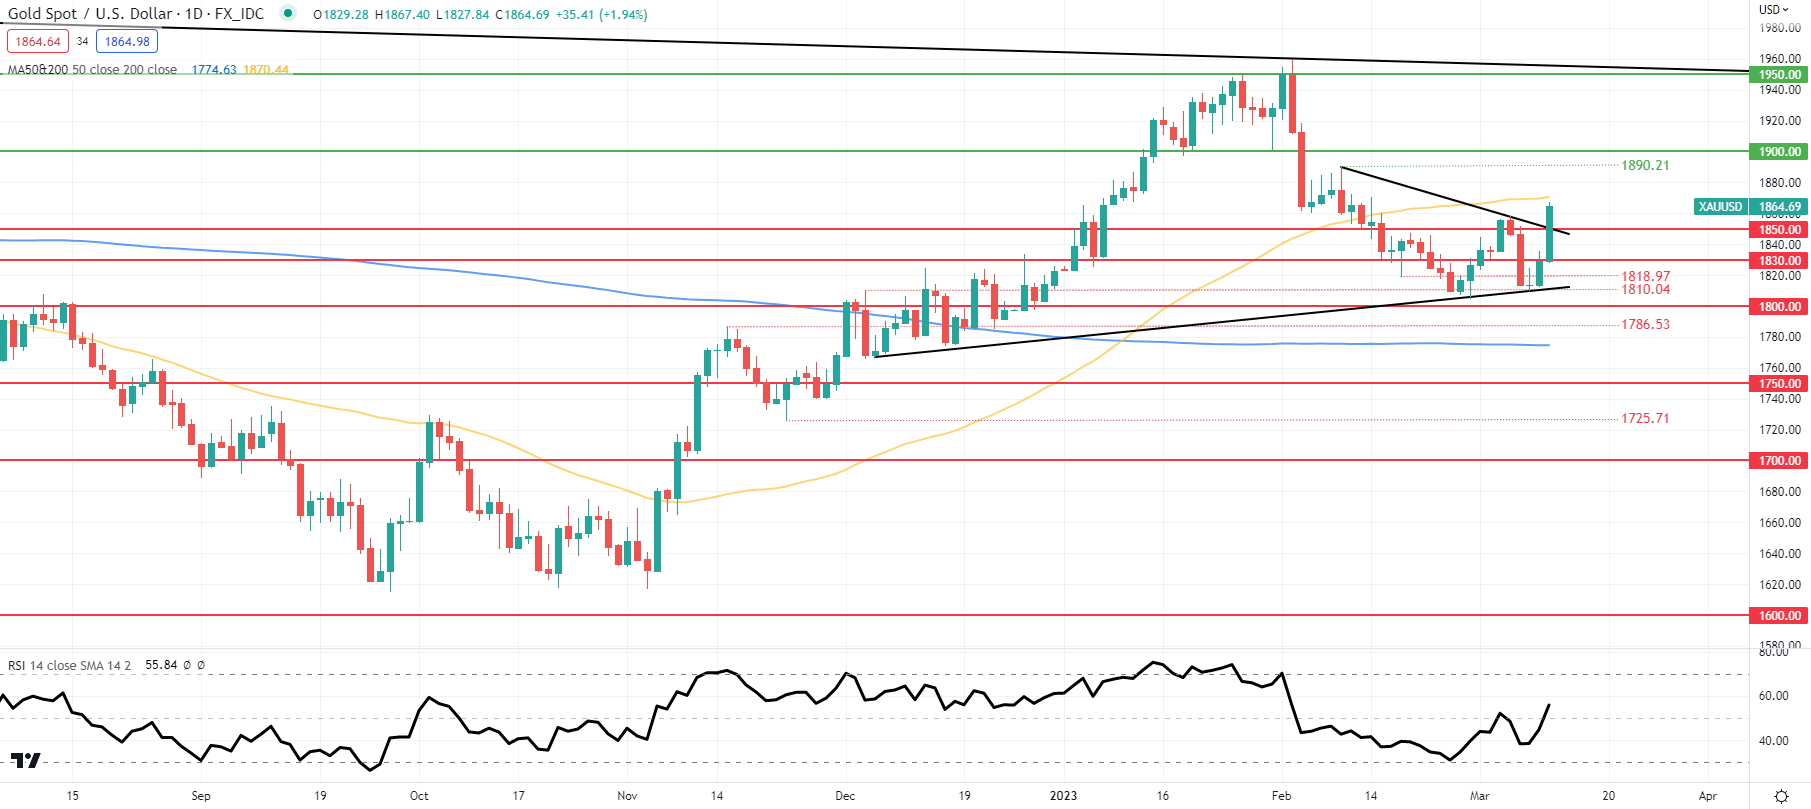
GOLD PRICE DAILY CHART
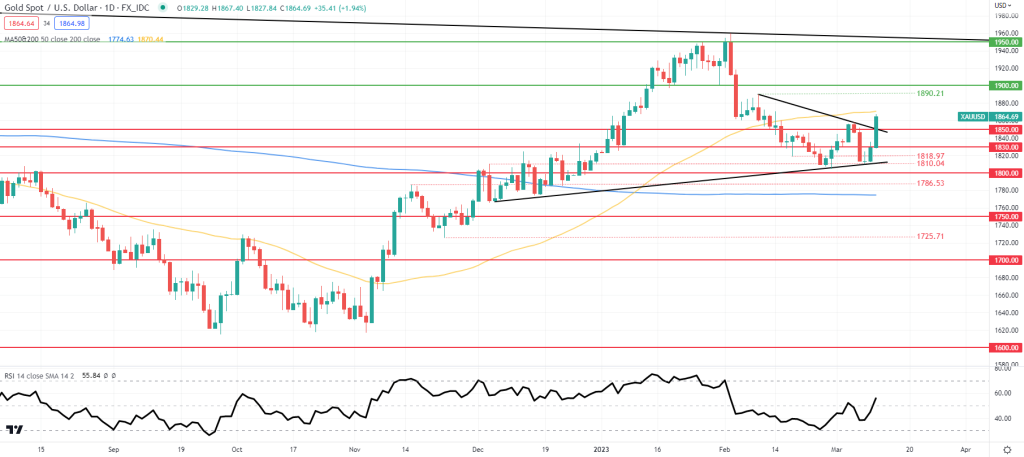
Daily XAU/USD price action shows a breakout from the recent symmetrical triangle chart pattern (black) and above the 1850.00 psychological handle. With the Relative Strength Index (RSI) now above the midpoint 50 level, bullish momentum is in favor but should Friday’s daily candle close below triangle resistance, this may be invalidated.
Resistance levels:
- 1890.21
- 50-day MA (yellow)
Support levels:
- 1850.00
- 1830.00