")

- Gold prices lacks directional conviction, swinging back and forth between gain and losses
- Despite Wednesday’s price action, the precious metal could come under pressure following the recent jump in rates
- U.S. Treasury yields soar after first-quarter GDP is revised sharply higher and unemployment claims surprise to the downside
Gold prices (XAU/USD) lacked directional conviction on Thursday in a volatile session. Early in the morning, the metal fell to its lowest level since March 15 following strong U.S. economic data, but then counter-intuitively managed to erase its decline to trade slightly higher near $1,910.
Key statistics released this morning showed that U.S. gross domestic product grew 2.0% annualized during the first quarter, well above the initial estimate of 1.3%, but the good news did not end there. The latest initial jobless claims batch surprised to the downside by a wide margin, clocking in at 239,000 versus the expected 265,000, reversing the upward trend of recent weeks and signaling that the labor market remains in good health.
US ECONOMIC DATA
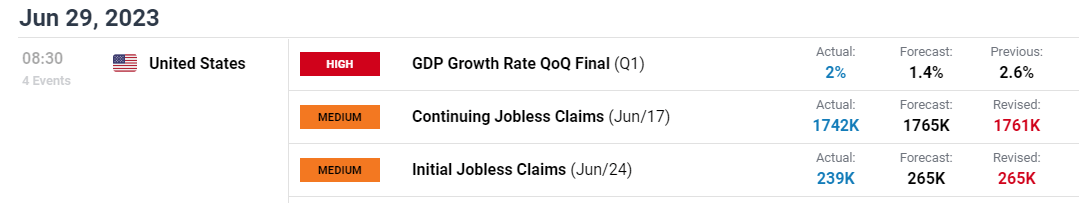
Solid macroeconomic results lifted U.S. Treasury yields across the curve, with the two-year note surging more than 15 basis points and coming within striking distance from hitting 4.9%, the highest level since March 9.
The move in rates, in turn, boosted the U.S. dollar against its lower-yielding counterparts, leading the DXY index to erase overnight session losses and climb into positive territory, creating a negative backdrop for precious metals, at least initially.
The remarkable resilience of the U.S. economy is likely to give the FOMC cover to raise rates again in the coming months, in line with its guidance. The Fed paused its hiking campaign in June, but signaled the process was not over, projecting 50 basis points of additional tightening through year’s end.
GOLD PRICES TECHNICAL CHART

GOLD PRICES TECHNICAL ANALYSIS
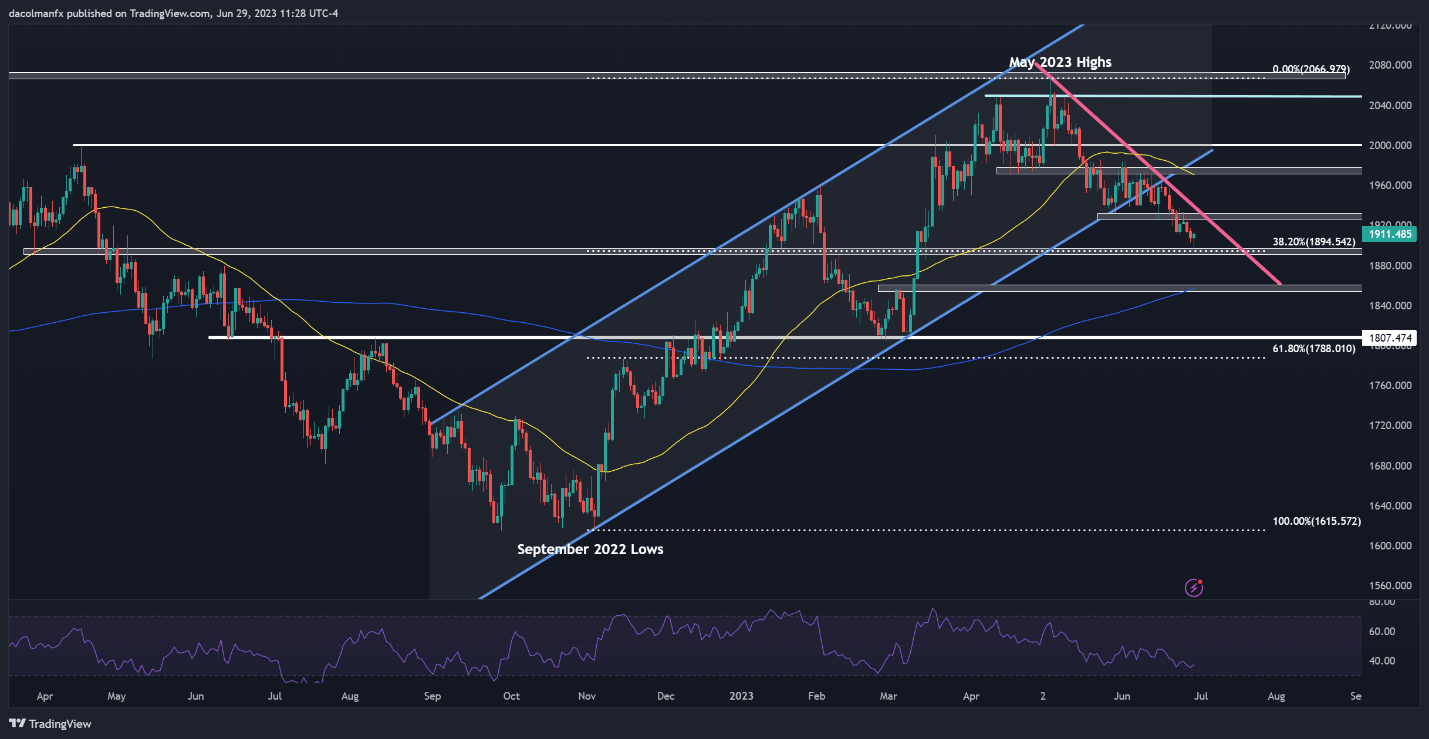
In terms of technical analysis, gold is hovering slightly above support at $1,895, corresponding to the 38.2% Fibonacci retracement of the Sept 2022 lows/May 2023 highs. Traders should carefully monitor this zone, as a breakdown reinforce downside pressure, setting the stage for a slump toward the 200-day moving average near $1,855.
Conversely, if buyers return to the market and trigger a rebound, initial resistance stretches from $1,925/$1,930. If this ceiling is breached, we could see a rally toward $1,970, around the 50-day simple moving average. On further strength, the focus shifts to the psychological $2,000 level.