")

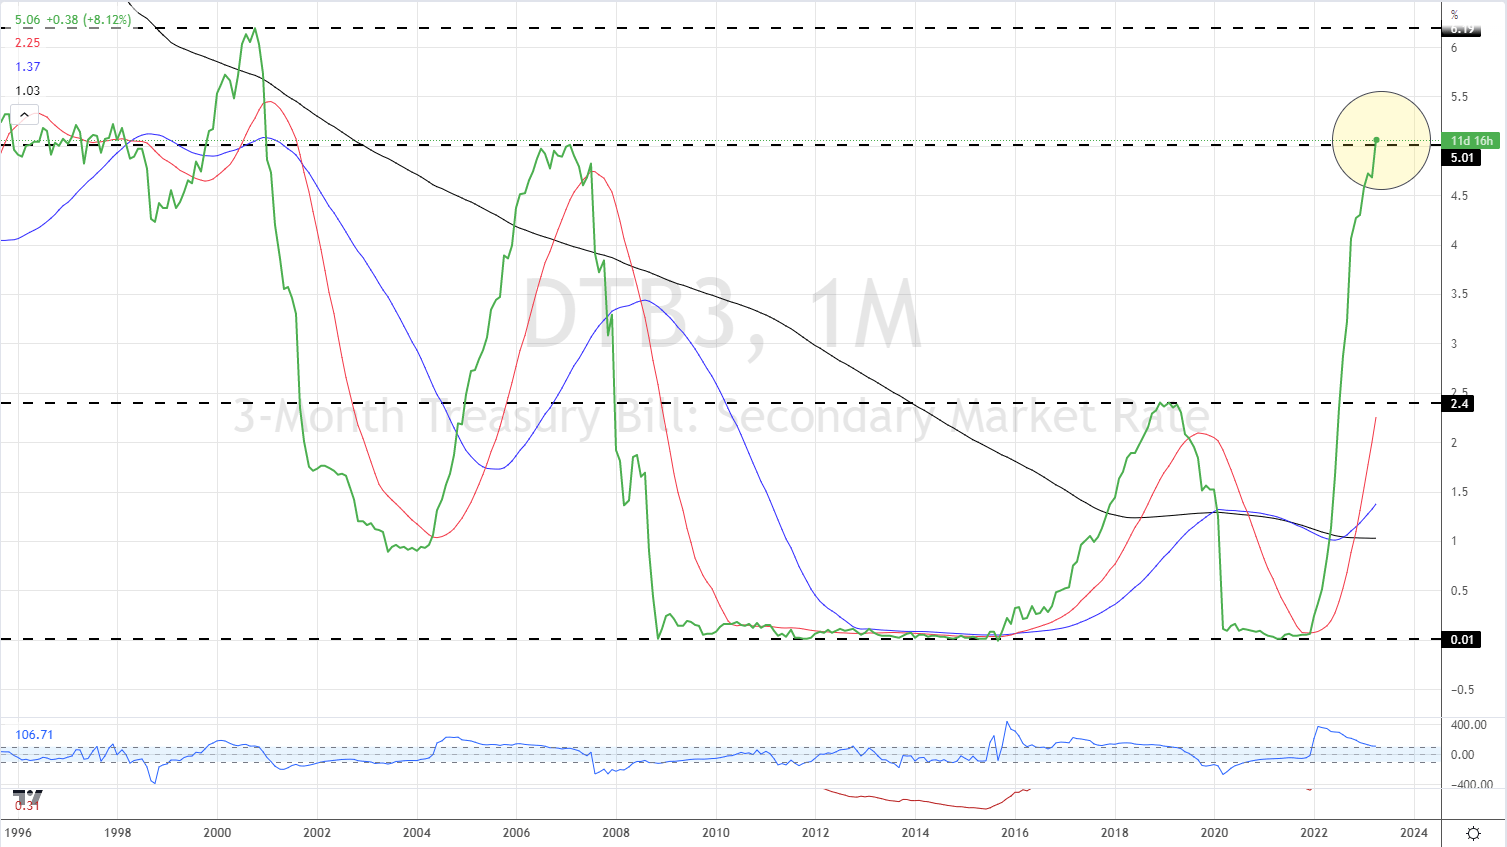
- US 3-month Treasury Bills yield in excess of 5%.
- Gold is likely to test support. Will it hold?
From building for a test of a new all-time high to testing prior levels of resistance in a matter of a few days, gold traders need to re-assess the reasons behind the precious metals’ move. The re-pricing of US rate expectations continues with short-dated yields continuing to push higher. The yield on the 3-month UST Bill is now above 5%, back at the highest level seen since January 2001, and up nearly 500 basis points from January 2022. This short-term rate re-pricing is weighing on gold.
US TREASURY 3-MONTH BILL YIELDS MONTHLY PRICE CHART – APRIL 19, 2023
Gold is now looking at an important support level near $1,961/oz, a prior level of resistance that turned into support. If this level is broken then the 23.6% Fibonacci retracement level at $1,947/oz. comes into play. It is likely that this level will hold once the current bout of rising UST yields abates. Resistance is seen around $2,009/oz. before $2,048/oz.
GOLD PRICE DAILY CHART – APRIL 19, 2023
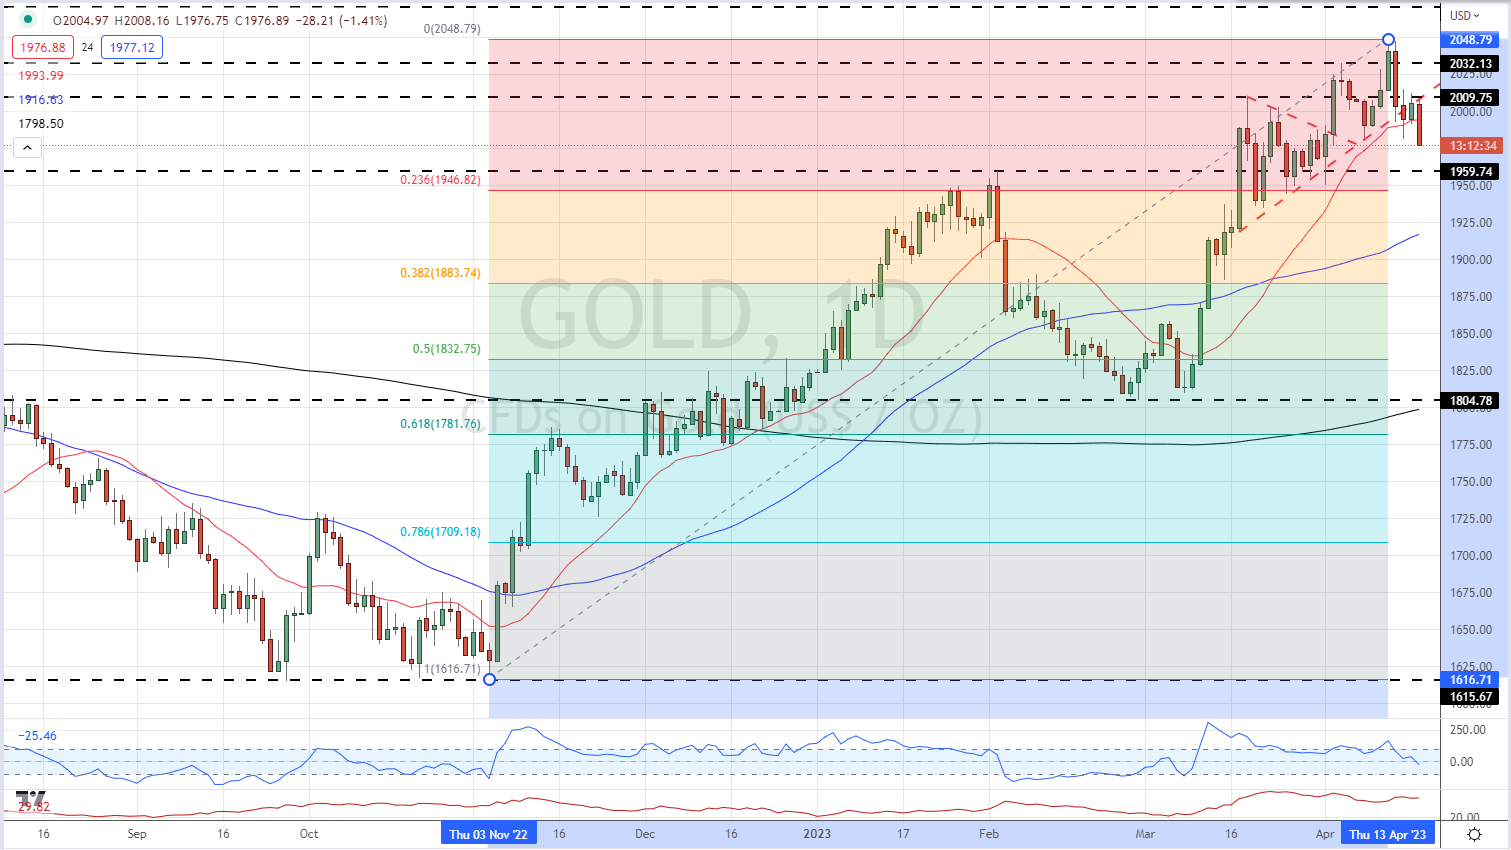
Chart via TradingView
EUR/USDBEARISH
Data provided by
57% of clients are net short.
| CHANGE IN | LONGS | SHORTS | OI |
| DAILY | -1% | -3% | -2% |
| WEEKLY | 11% | -12% | -3% |