")

- USD/CAD wavers after reaching a key technical resistance region, with bulls and bears fighting for control of the market
- USD/JPY heads lower and challenges trendline support as sellers eye a possible breakdown
USD/CAD TECHNICAL ANALYSIS
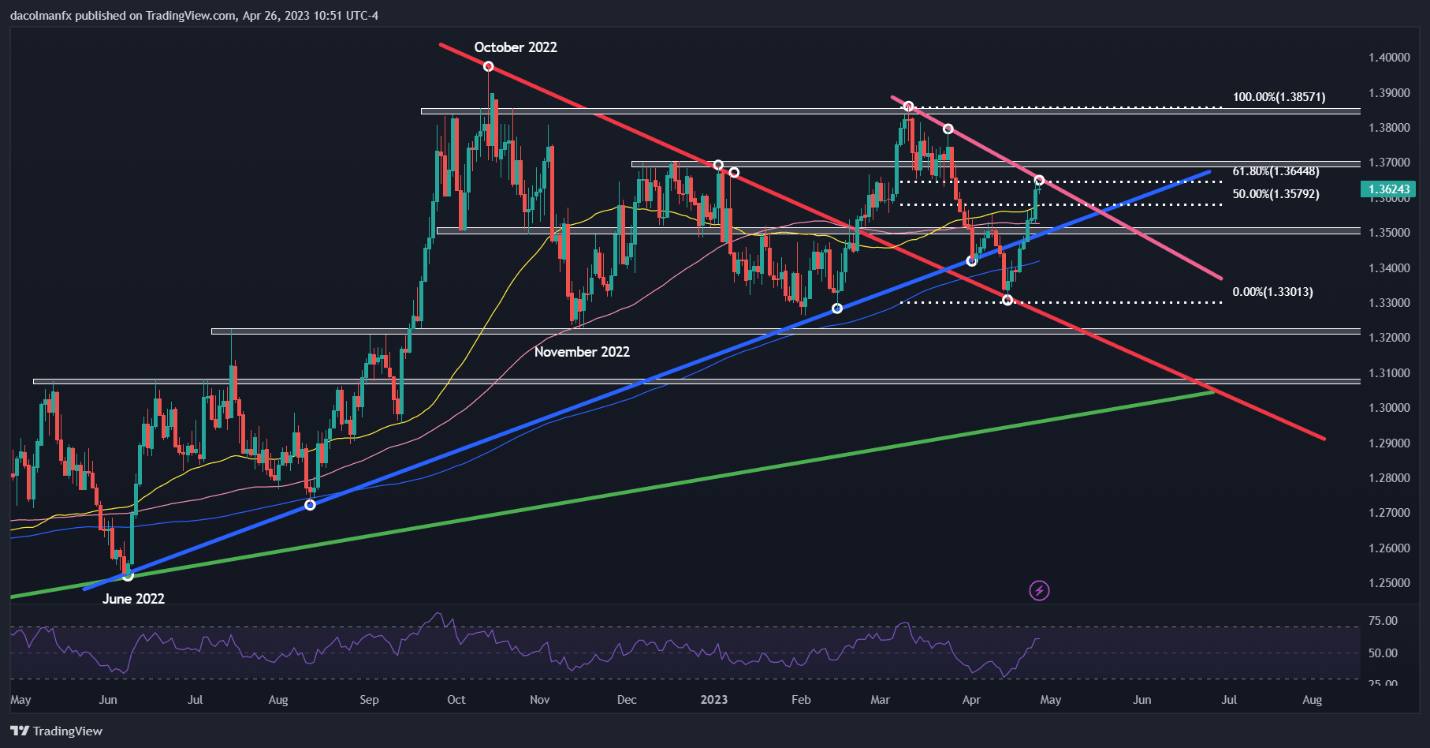
USD/CAD was largely flat on Wednesday despite broad U.S. dollar weakness in the FX space, oscillating between small gains and losses near the 1.3633 level, a key resistance region. The lack of direction may be due to market indecision following the pair’s strong rally in recent days, which saw the exchange rate appreciate by almost 2.6% in less than 10 trading sessions, so a pause makes sense from a technical standpoint.
With sentiment on fragile footing amid growing recession fears, high-beta currencies could underperform in the near term, creating a negative environment for the Canadian dollar, especially if market turbulence intensifies. In this context, USD/CAD remains well-placed to extend its advance heading into next month.
To have more conviction in the bullish scenario, the pair must clear confluence resistance at 1.3645 soon, a key technical barrier where short-term trendline resistance aligns with the 61.8% Fibonacci retracement of the March/April pullback. If this ceiling is breached, buyers could become emboldened to launch an attack on 1.3700, followed by the 2023 highs.
Conversely, if USD/CAD gets rejected from current levels and bears regain control of price action, the first support to consider appears at 1.3580, which corresponds to the 50-day simple moving average. If this floor is taken out, the next downside target to keep an eye on rests near the psychological 1.3500 handle.
USD/CAD BULLISH
Data provided by
66% of clients are net short.
| CHANGE IN | LONGS | SHORTS | OI |
| DAILY | -13% | 16% | 4% |
| WEEKLY | -35% | 40% | 0% |
USD/CAD TECHNICAL CHART
USD/JPY TECHNICAL ANALYSIS
While the U.S. dollar tends to appreciate against high-beta currencies during risk-off episodes, this dynamic does not frequently occur against the Japanese yen, which is also considered a safe-haven asset. For this reason, USD/JPY tends to be more sensitive to interest rate differentials between the US and Japan.
Turning our attention to technical analysis, USD/JPY has started to pull back in recent days after failing to break above resistance at 134.80, a sign that the bulls may be bailing amid the exhaustion of upside momentum.
With the pair moving towards trendline support at 133.00, sellers may be in a better position to regain the upper hand if they manage to push prices below that floor. Should this scenario play out, USD/JPY could head sharply lower, potentially challenging the 131.00 level in short order.
Conversely, if USD/JPY resumes its rebound and charges higher, it could encounter resistance at 134.80, but if a breakout materializes this time, buying momentum could accelerate, paving the way for a rally towards 136.60, the 38.2% Fibonacci retracement of the October 2022/January 2023 selloff.