")
- USD/JPY is challenging 133.00 again amid rebounding US Treasury bond yields.
- European stocks advance while US S&P 500 futures turn positive.
- Bearish 50DMA support is in sight amid the pullback from multi-week highs.
USD/JPY is regaining the upside traction in the European session, as risk sentiment rebounds on firmer European equities while the US S&P 500 futures turn positive on the day.
The positive shift in the market mood has reduced the demand for safe havens such as the US government bonds and the US Dollar, lifting the US Treasury bond yields across the curve. The benchmark 10-year US Treasury bond yields are up 0.71% on the day at 3.456%.
Earlier in Asian trading, the major faced rejection just shy of the 133.00 mark and turned south to test the 135.50 psychological level. The pair was last seen trading at 132.91, adding 0.40% on the day.
The further upside in the USD/JPY pair could depend on Wall Street performance, as the US Dollar is resuming its downside below 102.00 against its major rivals. On the data docket, the United States will feature the JOLTS Job Openings and the Factory Orders data in the North American session.
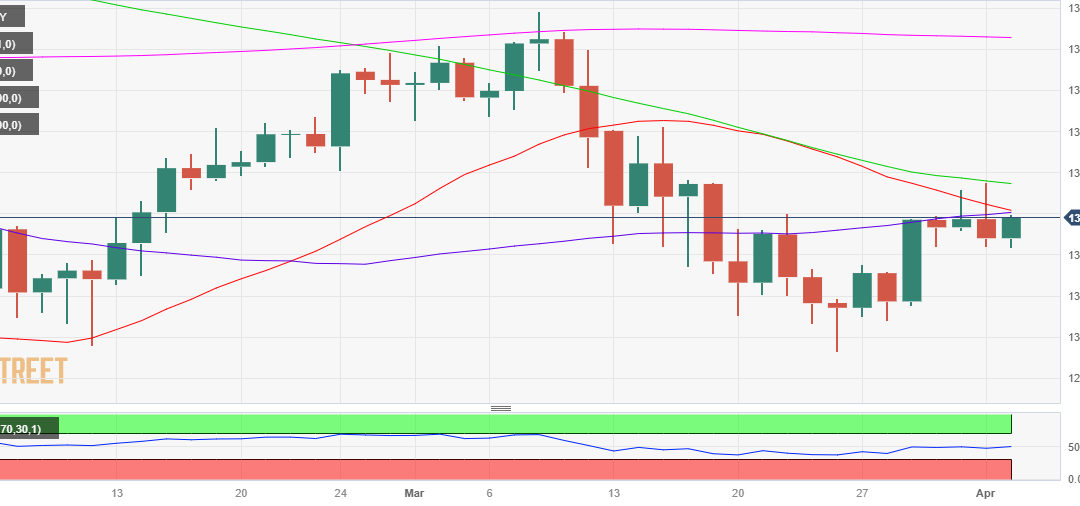
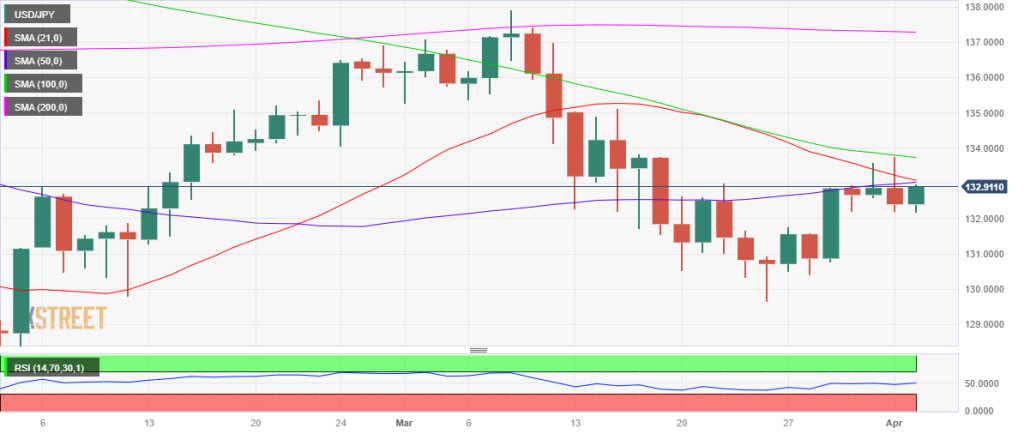
From a short-term technical perspective, USD/JPY is running into a critical resistance of the horizontal 50-Daily Moving Average (DMA) at 133.00.
The 14-day Relative Strength Index (RSI) is edging lower but holds well above the midline, suggesting that the upside momentum is likely to remain intact.
However, a potential 21 DMA and 50 DMA bearish crossover could warrant caution for USD/JPY buyers.
Therefore, bulls need acceptance above the 50 DMA barrier on a daily closing basis to break from the recent trading range and target the 133.50 static resistance.
USD/JPY: Daily chart
USD/JPY: Additional technical levels
USD/JPY
| OVERVIEW | |
|---|---|
| Today last price | 132.91 |
| Today Daily Change | 0.49 |
| Today Daily Change % | 0.37 |
| Today daily open | 132.41 |
| TRENDS | |
|---|---|
| Daily SMA20 | 133.09 |
| Daily SMA50 | 132.98 |
| Daily SMA100 | 133.8 |
| Daily SMA200 | 137.3 |
| LEVELS | |
|---|---|
| Previous Daily High | 133.76 |
| Previous Daily Low | 132.2 |
| Previous Weekly High | 133.6 |
| Previous Weekly Low | 130.41 |
| Previous Monthly High | 137.91 |
| Previous Monthly Low | 129.64 |
| Daily Fibonacci 38.2% | 132.8 |
| Daily Fibonacci 61.8% | 133.16 |
| Daily Pivot Point S1 | 131.82 |
| Daily Pivot Point S2 | 131.24 |
| Daily Pivot Point S3 | 130.27 |
| Daily Pivot Point R1 | 133.38 |
| Daily Pivot Point R2 | 134.34 |
| Daily Pivot Point R3 | 134.93 |