")
- WTI bulls are attempting to correct and have formed a solid support ground.
- Bears could be willing to take the bulls on at a premium from below trendline resistance.
West Texas Intermediate, WTI, has rallied towards a key resistance area as the following charts will illustrate. However, while a subsequent sell-off might be expected while on the front side of the bearish trend line resistance, there has been a firm layer of support put together near $74.00. Nevertheless, while below $77.00, the bias is to the downside.
WTI daily chart
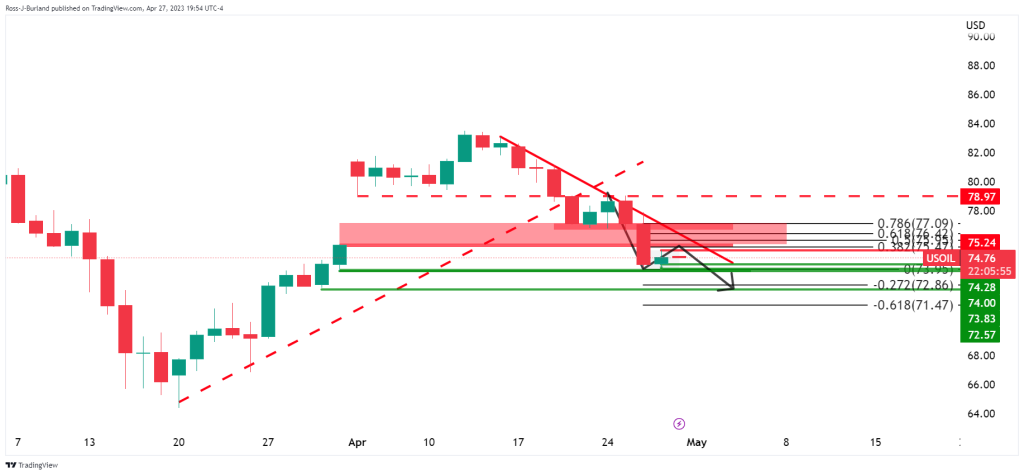
The trend is bearish while on the front side of the trend line and with room to go until $72.50.
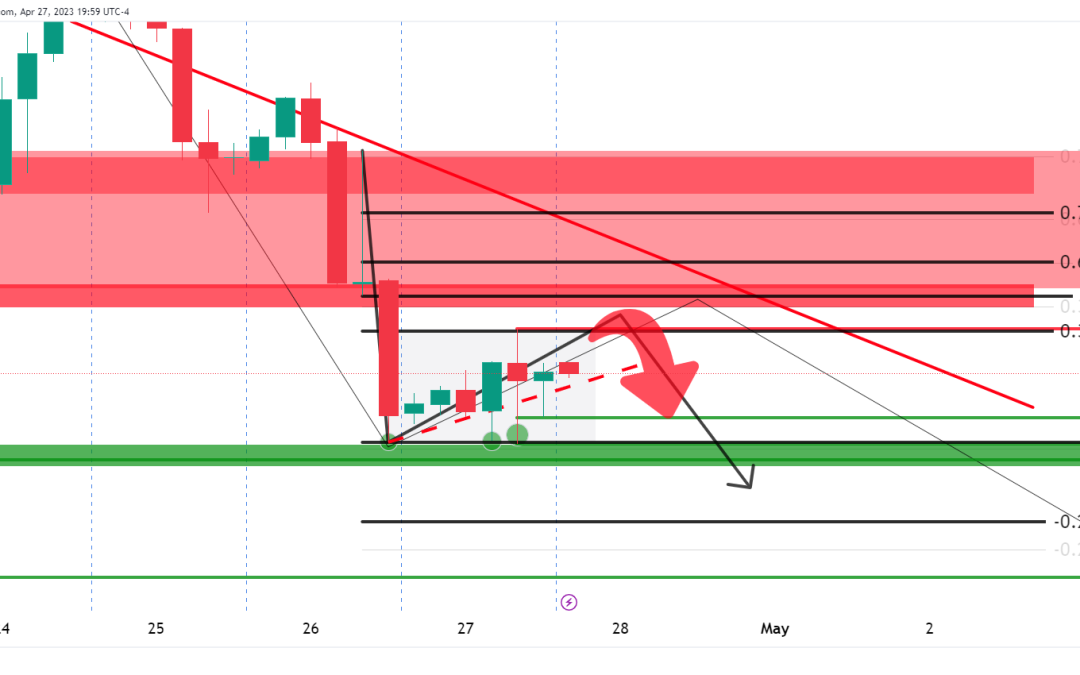
WTI H4 charts
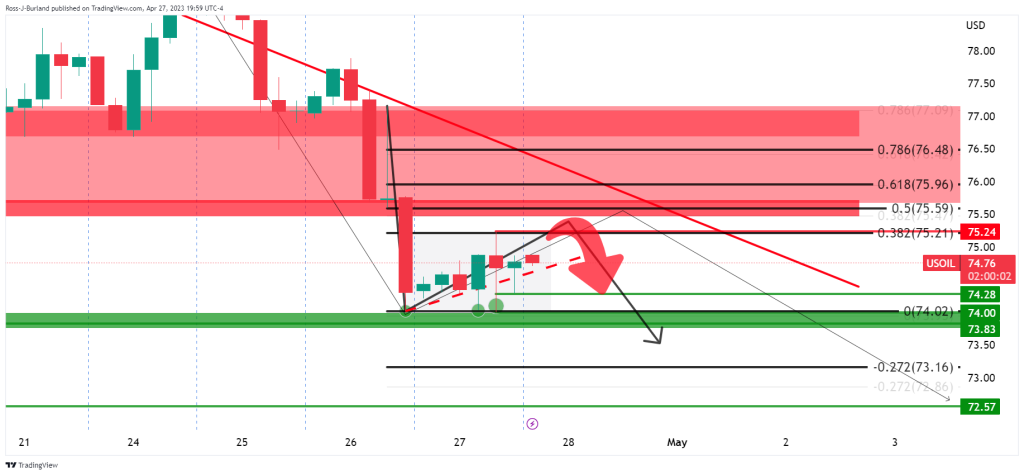
The prospects of a continuation of the correction toward $75.50s are good once $72.24 highs are cleared. However, given the firm support put in on the previous test to the downside, there is an even probability of a bullish continuation that could eventually take out the trend line resistance and open risks of a grind to the upside beyond $77.00 in a long squeeze back towards $79.00.